A plant ranking tells a multi-plant group which plant is best, not what it does differently. Compare the same operation across plants instead: the same part family on the same press type, measured from the machines' own signals. The timeline of a changeover shows the practice behind the shorter number, usually staging before the stop or tagging the reason at the machine. The receiving plant tries one practice on one cell, and the same measurement shows whether it took. Compare operations, not plants; review weekly, not monthly.
The league table nobody learns from
Most multi-plant groups we meet have a monthly review with one slide everybody remembers: the plants in a row, ranked by OEE. The plant at the top says little. The plant at the bottom arrives with explanations prepared the night before: a difficult product mix, an old press line. The meeting ends, the ranking is noted, and nothing moves from one plant to another.
We wrote earlier about the first step: one definition of downtime, produced the same way in every plant. This piece is about the second step. In our experience, once the numbers are comparable, the question changes. It is no longer “which plant is best” but “what does the best plant do that the others do not, and how do we move it”. A ranking answers the first question. Only the machines’ own data answers the second.
Compare operations, not plants
A plant total mixes everything: product mix, machine age, shift pattern. Two plants with the same OEE can be running very differently, and the plant three points behind may run one operation better than anyone in the group.
What the plants we connect compare instead is the same operation across plants: a press of the same tonnage running the same part family, a machining centre on the same casting. At that level, differences mean something. If the changeover on the same part family takes longer in one plant than in another, that is not product mix. It is a practice.
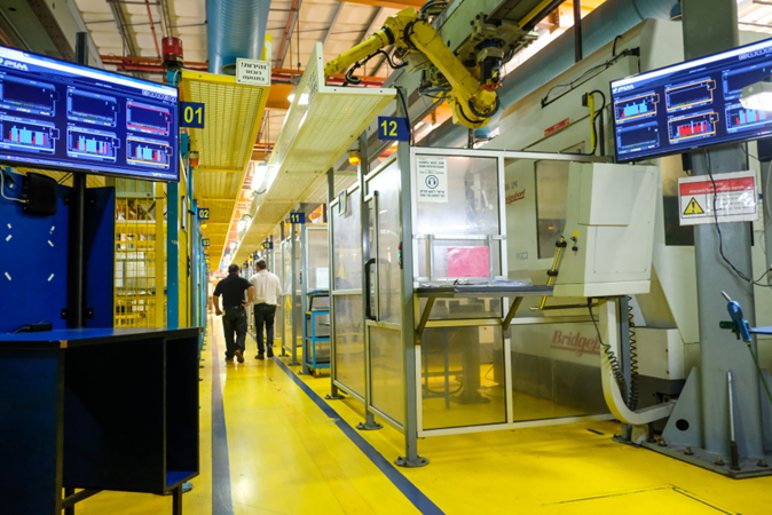
The comparison works because the data comes from the machines, in the same form everywhere. A small IoT device is connected to the machine’s electrical signals; an electrician installs it in under an hour; there is no PLC connection and no change to the programs, and the plant’s own people can do it. The signals are the same on every machine: running, stopped, cycle, count. What differs is the machine, the process, the product and the operating environment, even for two presses standing side by side, and all the more for two presses in two countries. The Universal Adapter, in the cloud, interprets the same signals with the context of that specific machine. So a press in Mexico and a press in Turkey deliver the same measured changeover duration, cycle per part and short stops per shift, ready to be put next to each other.
A number says which plant; the timeline says what they do
The KPI tells you that plant B’s changeovers on a given part family are shorter than plant A’s. It does not tell you why. The machine’s timeline can. In our experience, when you put the two changeovers side by side, minute by minute, the difference is rarely in the mechanical work. In plant A, the press stops and then waits: for the mold to arrive from the tool shop, for the setter who is finishing another machine, for the inspector to approve the first part. In plant B, the stop begins when the mold is already standing next to the press and the setter is already there. The practice is staging, and nobody in plant B had thought of it as a practice worth writing down.
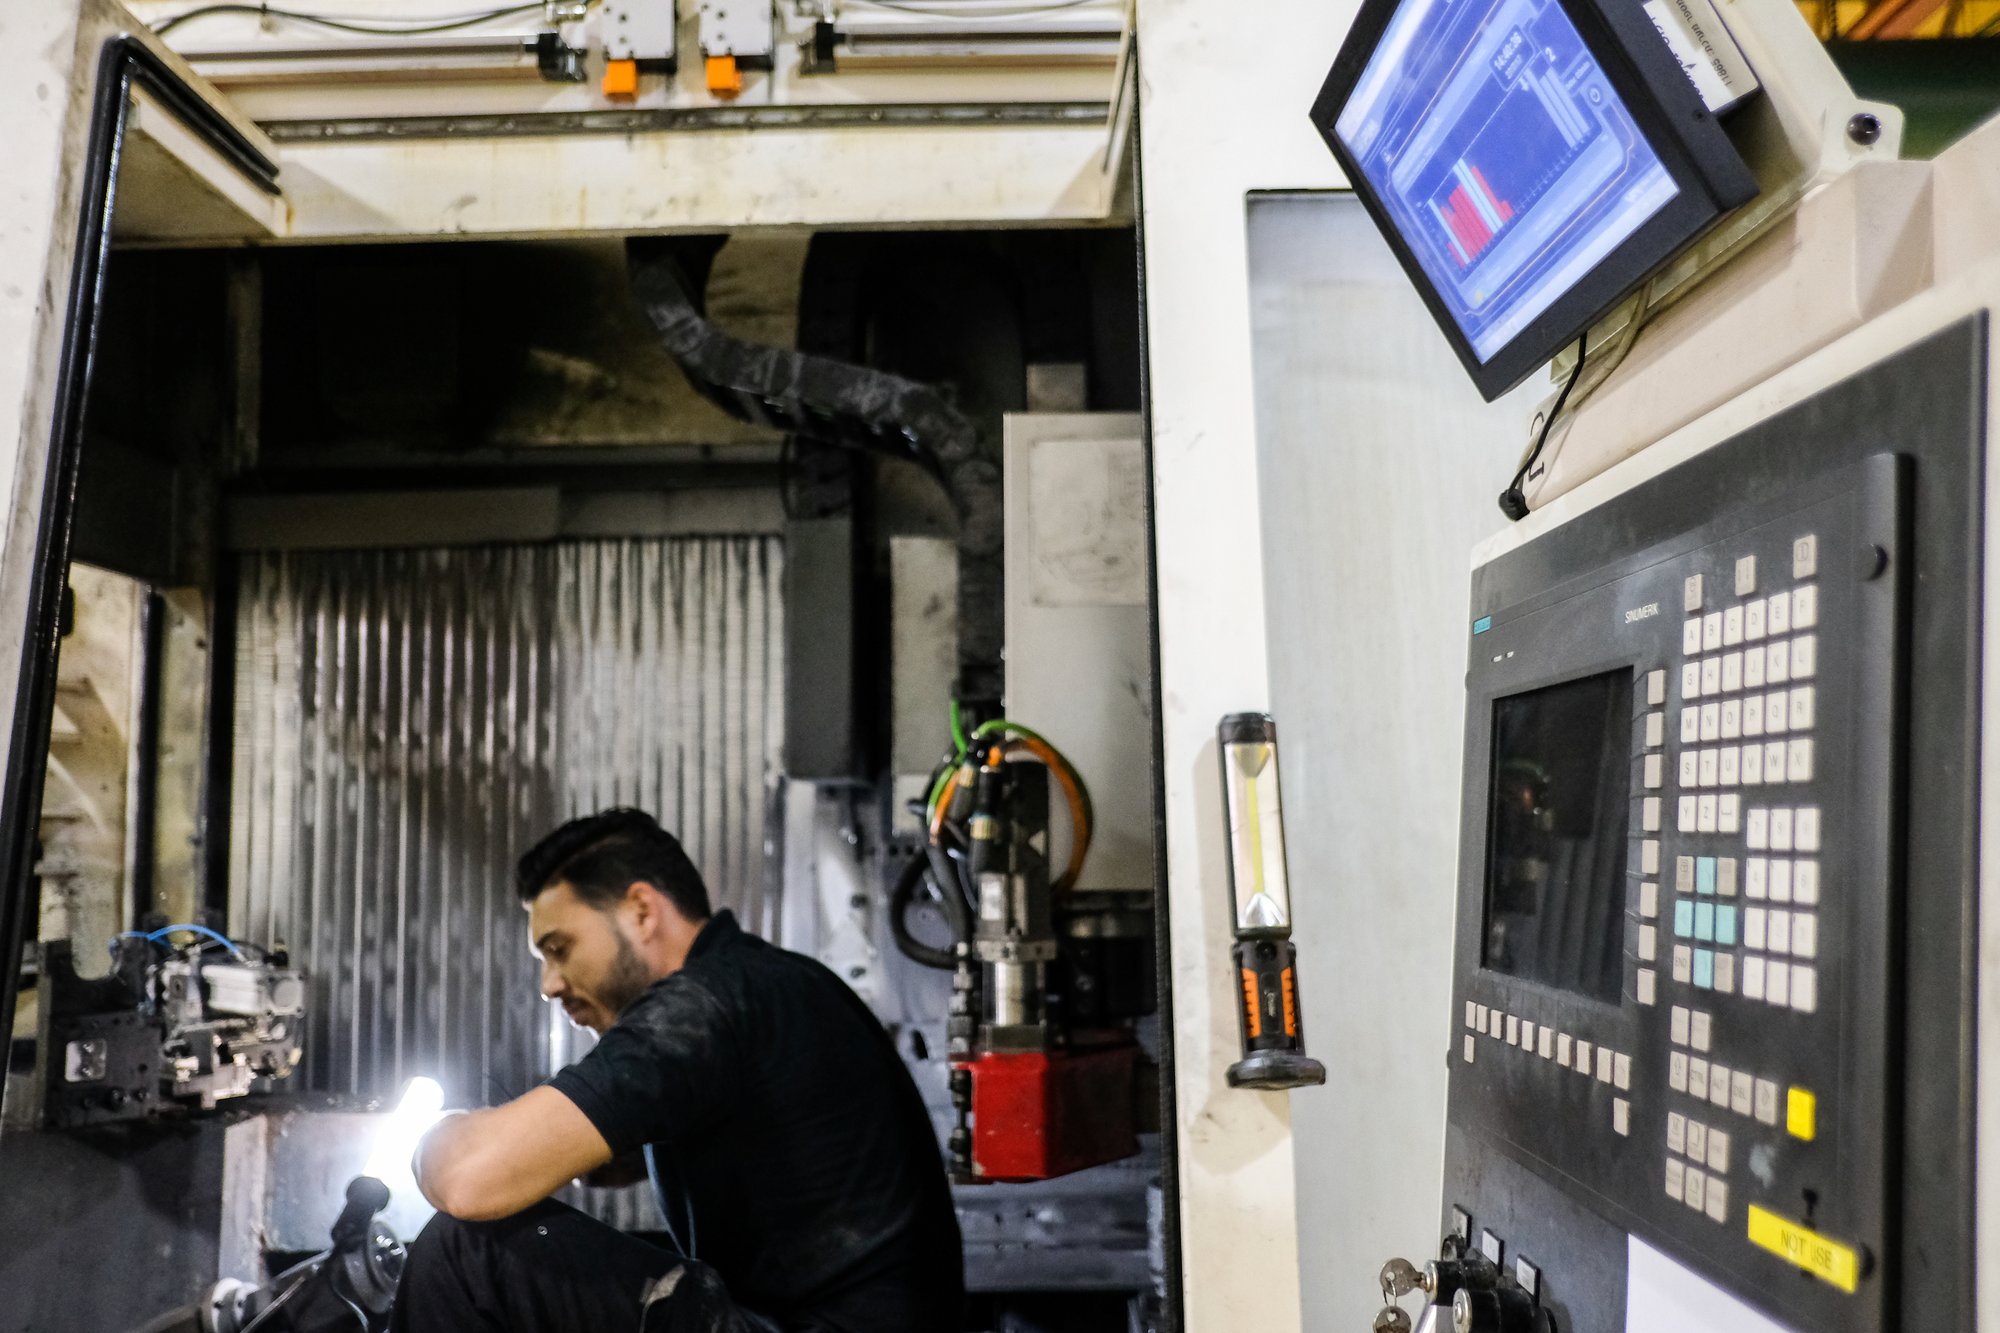
The same thing shows up elsewhere. One plant’s operators tag the reason for a stop on the floor monitor as it happens; in a sister plant the supervisor fills the reasons in at the end of the shift, and “other” is the most common one. None of this is visible in a plant OEE. All of it is visible at the machine, and all of it is a habit that can travel.
How the group review changes
The groups that get value from the comparison run the review differently from the ranking meeting, in four small ways.
- Same report in every plant. The plant’s own daily report, with measured changeovers, cycle per part and stops by reason, is what head office sees too.
- Open with one operation across plants, not one plant across operations. The question on the table is “the changeover on this part family, in these four plants”, with the measured timeline for each.
- The best plant explains how, not the worst plant why. The plant with the shortest measured changeover walks through its timeline and the others ask questions. This alone changes the tone of the meeting.
- One practice, one cell, a few weeks. The receiving plant picks one practice and tries it on one press or one cell. The same measurement that found the difference shows whether the practice took: the changeover duration on that press, week by week, not an impression.
Head office owns the frame, the agenda and the measurement; the plants own the practices, in their language and with their people. The plant looks at its own machines daily and the group looks at one operation across plants weekly, close enough to the shift to matter.
Two things that go wrong
Ranking plants in public. As soon as the ranking carries consequences, the number gets managed rather than improved. Stops migrate into the planned category, base hours shrink, and within a few months the plants are no longer comparable. The comparison has to be about operations and practices, and it has to be safe to be at the bottom of it for a while.
Copying the practice as a procedure, without the measurement. A staging instruction is written, signed and posted at the press. In our experience it holds for a few weeks and then fades, because the setter is needed elsewhere and nobody sees the changeover growing again. With the measured duration on the floor monitor and the daily report, the fade is visible the week it happens.
What we learned
The point of connecting the machines in every plant of a group is not a fairer ranking. It is to see, at the level of one press and one changeover, what the best plant actually does, and to have the same measurement waiting in the plant that tries it next. In our experience, the practices that travel best are the small ones nobody had named: staging before the stop, tagging the reason at the machine. They are found in the timeline, not in the KPI.
The same platform gives one plant its daily report and the group its comparison, from the same device on each machine. You can read how the Visual Factories products fit together, and to see one operation across two of your plants, bring it to a demo and we will show you where the difference usually sits.
Questions people ask
Why not compare plant OEE directly across a group?
A plant total mixes product mix, machine age, shift pattern and the changeovers the customer forced that month. Two plants with the same OEE can run very differently. Comparing the same operation, the same part family on the same press type, shows differences that are practices, not mix.
How can machines in different countries deliver comparable numbers?
A small IoT device on each machine's electrical signals, installed by an electrician in under an hour with no PLC connection and no change to programs, reads the same four signals everywhere: running, stopped, cycle, count. The Universal Adapter interprets them with the context of each specific machine, so changeover duration, cycle per part and short stops are measured the same way in every plant.
How does a group know a practice has really moved to another plant?
By the same measurement that found the difference. The receiving plant tries the practice on one press or cell and watches the measured changeover duration or stop count on that machine week by week. If the practice fades, the number shows it in the first week it happens.