





Products · The Visual Factories platform

One platform.
Any machine.

Your floor already knows why you're losing output. Connect it in days — no IT project — and run every Visual Factories application on the same live data.

14 daysto visibility, any machine
20% OEEgain in 4–12 weeks
Money-backSLA guarantee
Rolls-Royce Pratt & Whitney Gühring Dinex Tecvox TrinityRail TAV Medical
The problem

Every car and every aeroplane is built on thousands of components, produced on thousands of different machines.
Almost none of them are talking.

Those components are machined, molded, pressed, welded and assembled by Tier 1, 2 and 3 suppliers of every size, on an enormous variety of machines. That variety is exactly what keeps the floor blind.

01

Connectivity is complex, expensive and out of reach

Large plants pay system integrators to wire machines up. Independent plants — 75% of the market — can't afford to, so the data never exists.

02

Monitoring and control are still manual

Whiteboards, spreadsheets and end-of-shift reports. By the time a problem is visible, the shift is gone and so is the output.

03

Machines and software don't interoperate

ERP, planning, tooling and maintenance each see a slice. Nobody sees the floor as one system — so nobody can optimize it.

The result: you pay for uptime, stay blind to downtime, and lose on operations cost.
The foundation · Connectivity & Visibility

Connect any machine. See one truth. Then build on it.

One technology does the work: Visual Factories' cloud-based Universal Adapter analyzes a machine's signals and turns them into production data — any brand, any age, any process. A machine electrician connects the machine in less than an hour; no systems integrator, no months.

  • Any machine, fast. CNC, injection molding, presses, SMT, cutting, welding, printing, assembly, packaging, extrusion, inspections, end-of-line cells. All through electrical signals — the lowest common denominator of any machine.
  • Uptime, downtime and throughput from day one. Automatically, without operators typing anything.
  • One source of truth. Real-time OEE, WIP, on-time delivery, direct-labor efficiency and cost per part on one live screen — for the floor, the office and the executive.
  • Plug & play, DIY installation. Step-by-step guidance, with support when needed. No IT project, no server, no downtime.
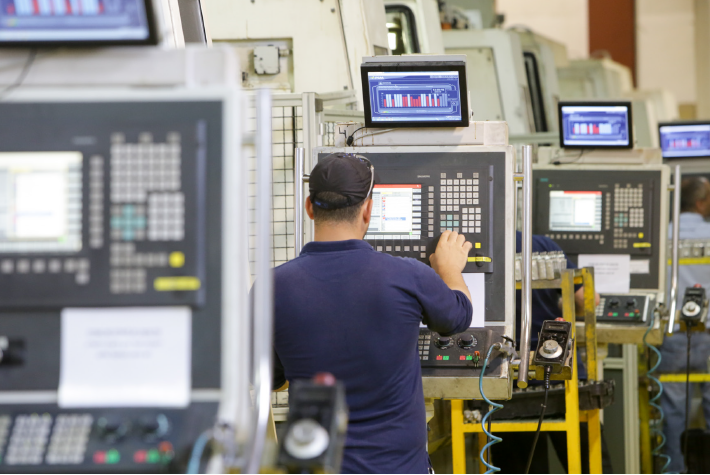
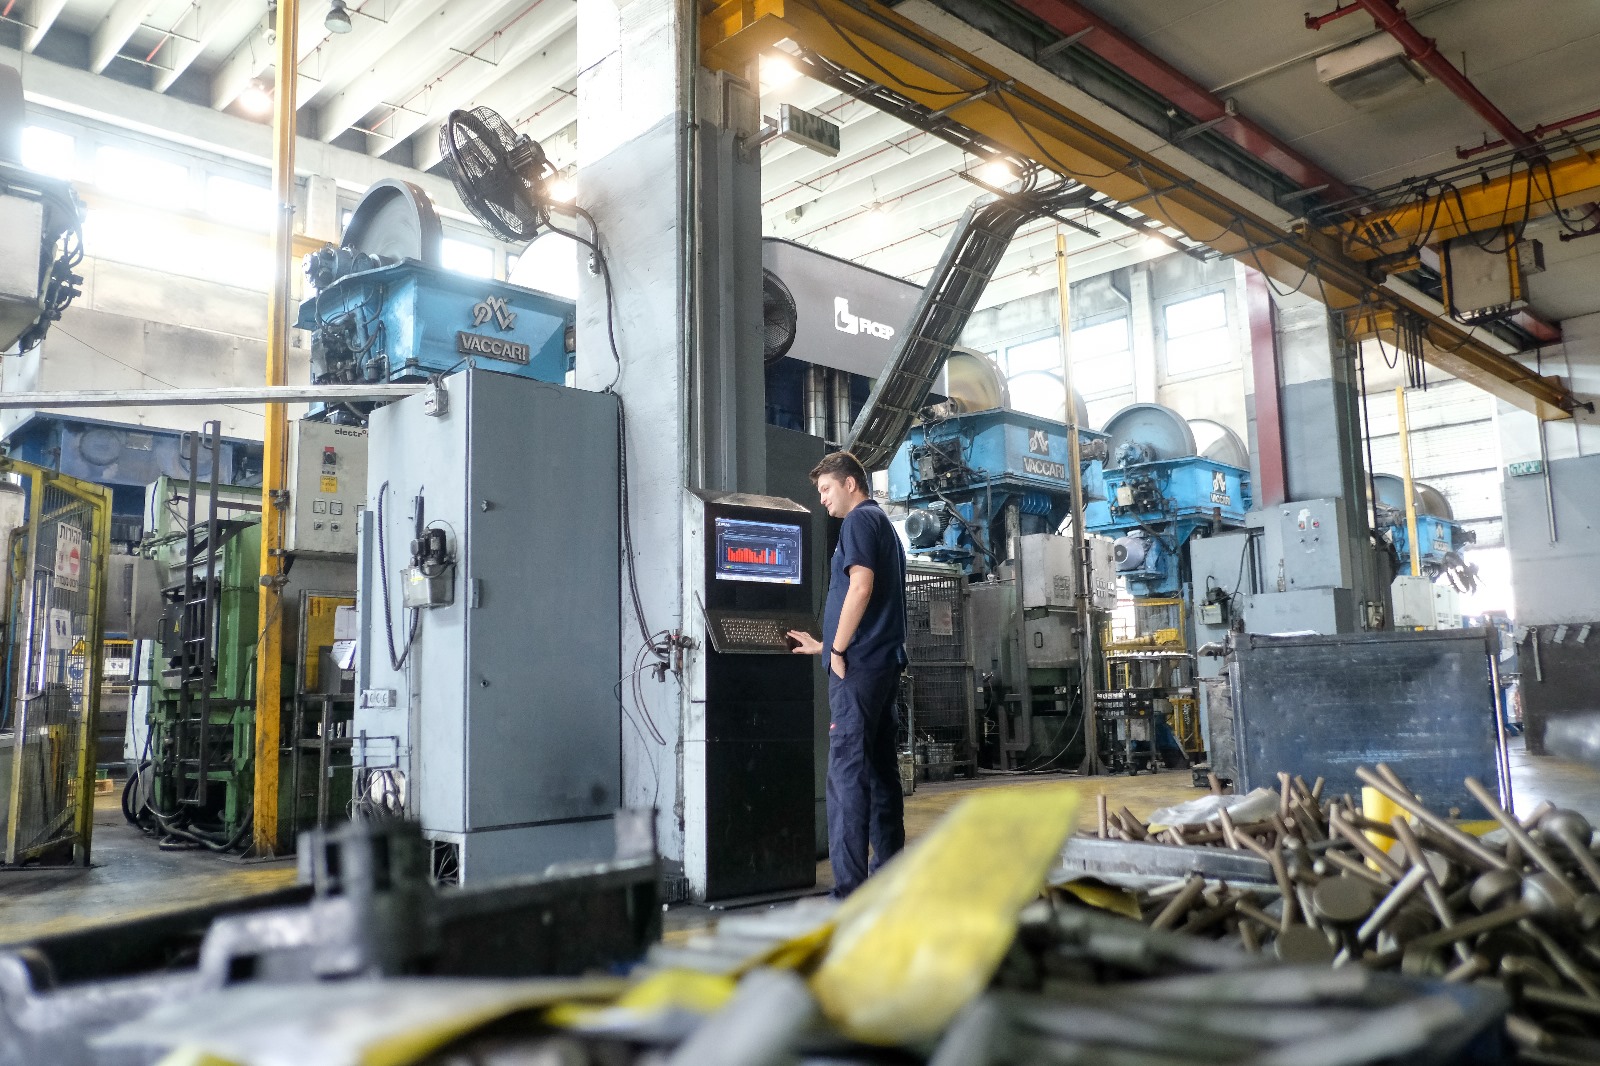
Operator checking live machine data on the shop floor
Why it is so simple on the floor

The brain is in the cloud. The floor only plugs in.

At the heart of Visual Factories is one technology: proprietary signals interpretation. Whatever comes in from a machine, the Universal Adapter — in the cloud — analyzes the signals and turns them into production data: uptime, downtime, throughput, and the reasons behind them. The source of the signals can change. The technology and the result don't.

The simplest source is the one every machine has: its electrical signals. They exist on every machine ever built — a thirty-year-old press or a new five-axis center — and a machine electrician captures them with our IoT device in less than an hour. That is all we need. What is easily available on any machine is enough for us to deliver full visibility in 14 days and the 20% OEE improvement in 4–12 weeks.

That is why the floor stays simple. The device has one job — capture the signals and send them over Wi-Fi or LAN. No programming, no server, no IT project.

If you prefer, we also connect through the machine's own protocol — OPC UA, MTConnect, databases, log files — with out-of-the-box solutions, including our own MTConnect adapters for the major CNC controls such as Siemens, Fanuc, HAAS, Heidenhain and Mitsubishi. These are pure software integrations, with no hardware — which is exactly what brings IT involvement and complexity: they exist on only a small share of modern machines and are often not easy to access. Where they are available and you want them, we use them. Either way, the same Universal Adapter delivers the same result.

Source · on the machine
Signals — from any source

Electrical signals via our IoT device: every machine has them; an electrician captures them in under an hour.Or, if you prefer, the machine's protocol: OPC UA, MTConnect, database, log files — software only, no hardware, but requires IT.

In the cloud
Universal Adapter — signals interpretation

Analyzes the signals and produces the result, whatever the source: uptime, downtime, throughput and root cause. One technology for every machine.

Everywhere
Live applications

OEE, scheduling, tool life, supply-chain visibility — on the floor monitor, in the office and on the phone.

Time to visibility

The 14-day Activation Sprint

MONEY-BACK SLA · OR A FREE POC
Days −7 to −1 · Pre-sprint
Readiness check

Machine list confirmed, electrical diagrams in hand, network access validated, project owner named. The SLA clock starts only when these are confirmed.

Days 1–7 · Connect
Signals & validation

IoT devices installed by your electrician. Signals validated against known production reality. Dashboards configured. KPI definitions confirmed.

Days 8–14 · Land
Training & kickoff

Operator, supervisor and management training. KPI workshop. By day 14 your team is using VF data in real meetings.

Applications

Everything runs on the same live machine data.

Start with the one that hurts most. Add the others without a new project — the connection is already there.

The foundation

Connectivity & Visibility

One signals-interpretation technology — the cloud-based Universal Adapter — turns any machine's signals into real-time OEE, uptime, downtime and throughput. The platform every application below runs on, and the first 14 days of every engagement.

How the platform works
  • Electrical signalsthe lowest common denominator — every machine has them
  • < 1 hourinstalled by a machine electrician — no programming, no IT project
  • 14 daysto full visibility — then 20% OEE improvement in 4–12 weeks
01

OEE Improvement

The closed loop: AI root-cause on top offenders, turned into assigned tasks. 20% OEE gain in 4–12 weeks, verified on production data.

Improve OEE
02

OEM Supply-Chain Visibility

One live window across nominated supplier cells. The OEM sees the ramp risk in real time; the supplier pays and profits.

See the supply chain
03

Scheduling & Dispatching

Replace the whiteboard. Live machine timeline, unassigned-task list, ERP gateway or CSV upload, daily PDF reports.

Digitize scheduling
04

CNC Programs — Upload & Download

Manage, version and transfer programs to any CNC control — including legacy machines — from one place, with a full audit trail.

Manage CNC programs
05

Cutting Tools — Tool Life & Cost per Part

Replace tools on time, avoid scrap, protect machine health, manage inventory — and buy on cost per part, not tool price.

Monitor tool life
06

Molds — Tracking & Monitoring

Know where every mold is, how many shots it has run, and when it needs maintenance — across plants and suppliers.

Track molds
07

Condition-Based Maintenance

Maintenance triggered by real machine condition — MTBF/MTTR, downtime reasons, consumables — turned into tasks. Complements your CMMS.

Maintain on condition
How it works

One closed loop. Improvement is the outcome of running it.

The system does the work. People follow the loop.

01

Connect

Any machine, in hours. No IT project.

Zero engagement
02

Empower

Floor monitors show live targets. Teams self-manage.

Passive engagement
03

Analyze

Full OEE root-cause on top offenders. Data, not gut feel.

Minimal engagement
04

Act

Plans built, assigned, done. An executive keeps it moving.

Executive engagement

AI agent

Finds the cause, creates the task, makes sure people act.

Automation
05

Improve

Continuous and measurable. The outcome of running the loop.

Result
AI in action

Measurement becoming improvement.

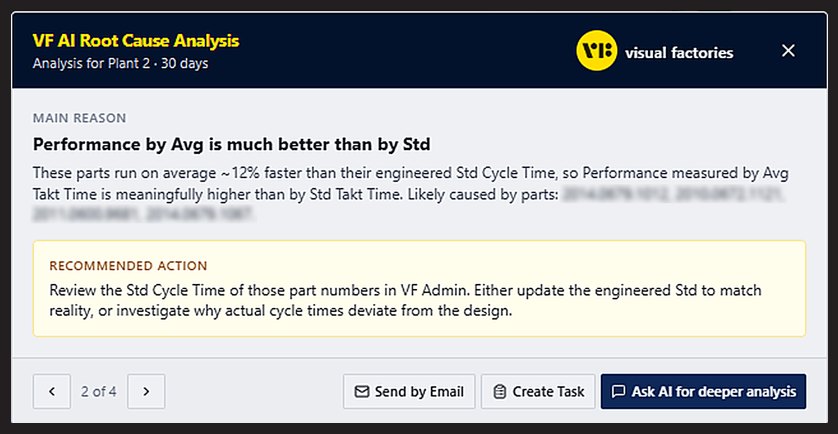
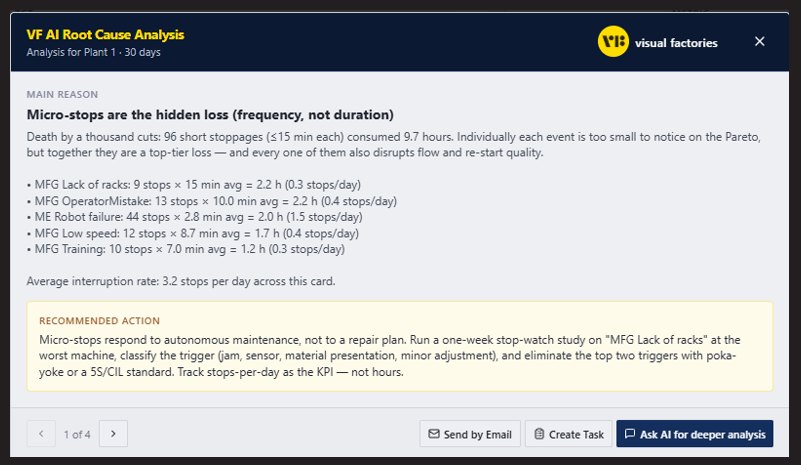
Live from the VF platform: the AI agent finds the reason behind a loss, recommends the action and creates the task — assigned to the right person and tracked through to done. No meetings, no spreadsheets, no lost follow-ups.

See it on your data →
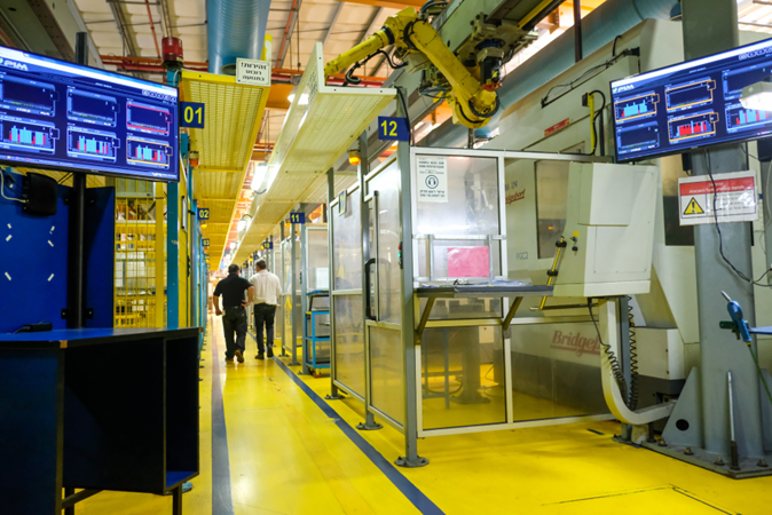
VF floor monitors above the machines
What the AI agent tells you — main reason, recommended action, one click to create the task
VF AI root-cause analysis: micro-stops are the hidden loss
Finds the hidden loss — micro-stops by frequency, not duration — and prescribes the fix.
VF AI root-cause analysis: performance by average vs standard
Spots where the standard is wrong, and tells you exactly what to review.
Measured results

Three cells. Three processes. Same loop.

49% →
62% OEE

13-machine cell, Plant 1 — Tier-1 automotive supplier

48% →
83% OEE

4-machine injection-molding cell — same supplier

59% →
82% OEE

2-machine end-of-line cell — same supplier
Baseline measured Nov 2025 – Jan 2026. Improvement measured April 2026. Verified against production data.
Production team on the floor
Real floors, real teamsAutomotive, aerospace, electronics, medical devices and packaging — ten years in the most demanding discrete-manufacturing environments.
Case study — Tier-1 automotive supplier
Case study · Tier-1 automotive supplier

Increasing revenue, cutting costs, and reducing overtime

  • +27%OEE
  • +23%production per day
  • −63%overtime hours
  • −68%defect parts per million
Read the case study PDF · free download
Free download

The Visual Factories platform overview

What connects, what you see on day 1, day 14 and week 12, and how each application pays for itself. Written for plant managers and operations executives.

PDF · includes the 14-day sprint readiness checklist


    See your own floor in 14 days.

    Pick the cell that's gating your output. We connect it, validate the data against reality, and put live numbers in front of your team — or you don't pay.

    ✓ 14-day Activation Sprint✓ Money-back SLA✓ No IT project✓ ISO 27001
    Scroll to Top

    Schedule a Free Trial

    Please fill in your details so we can get in touch and start your free trial.