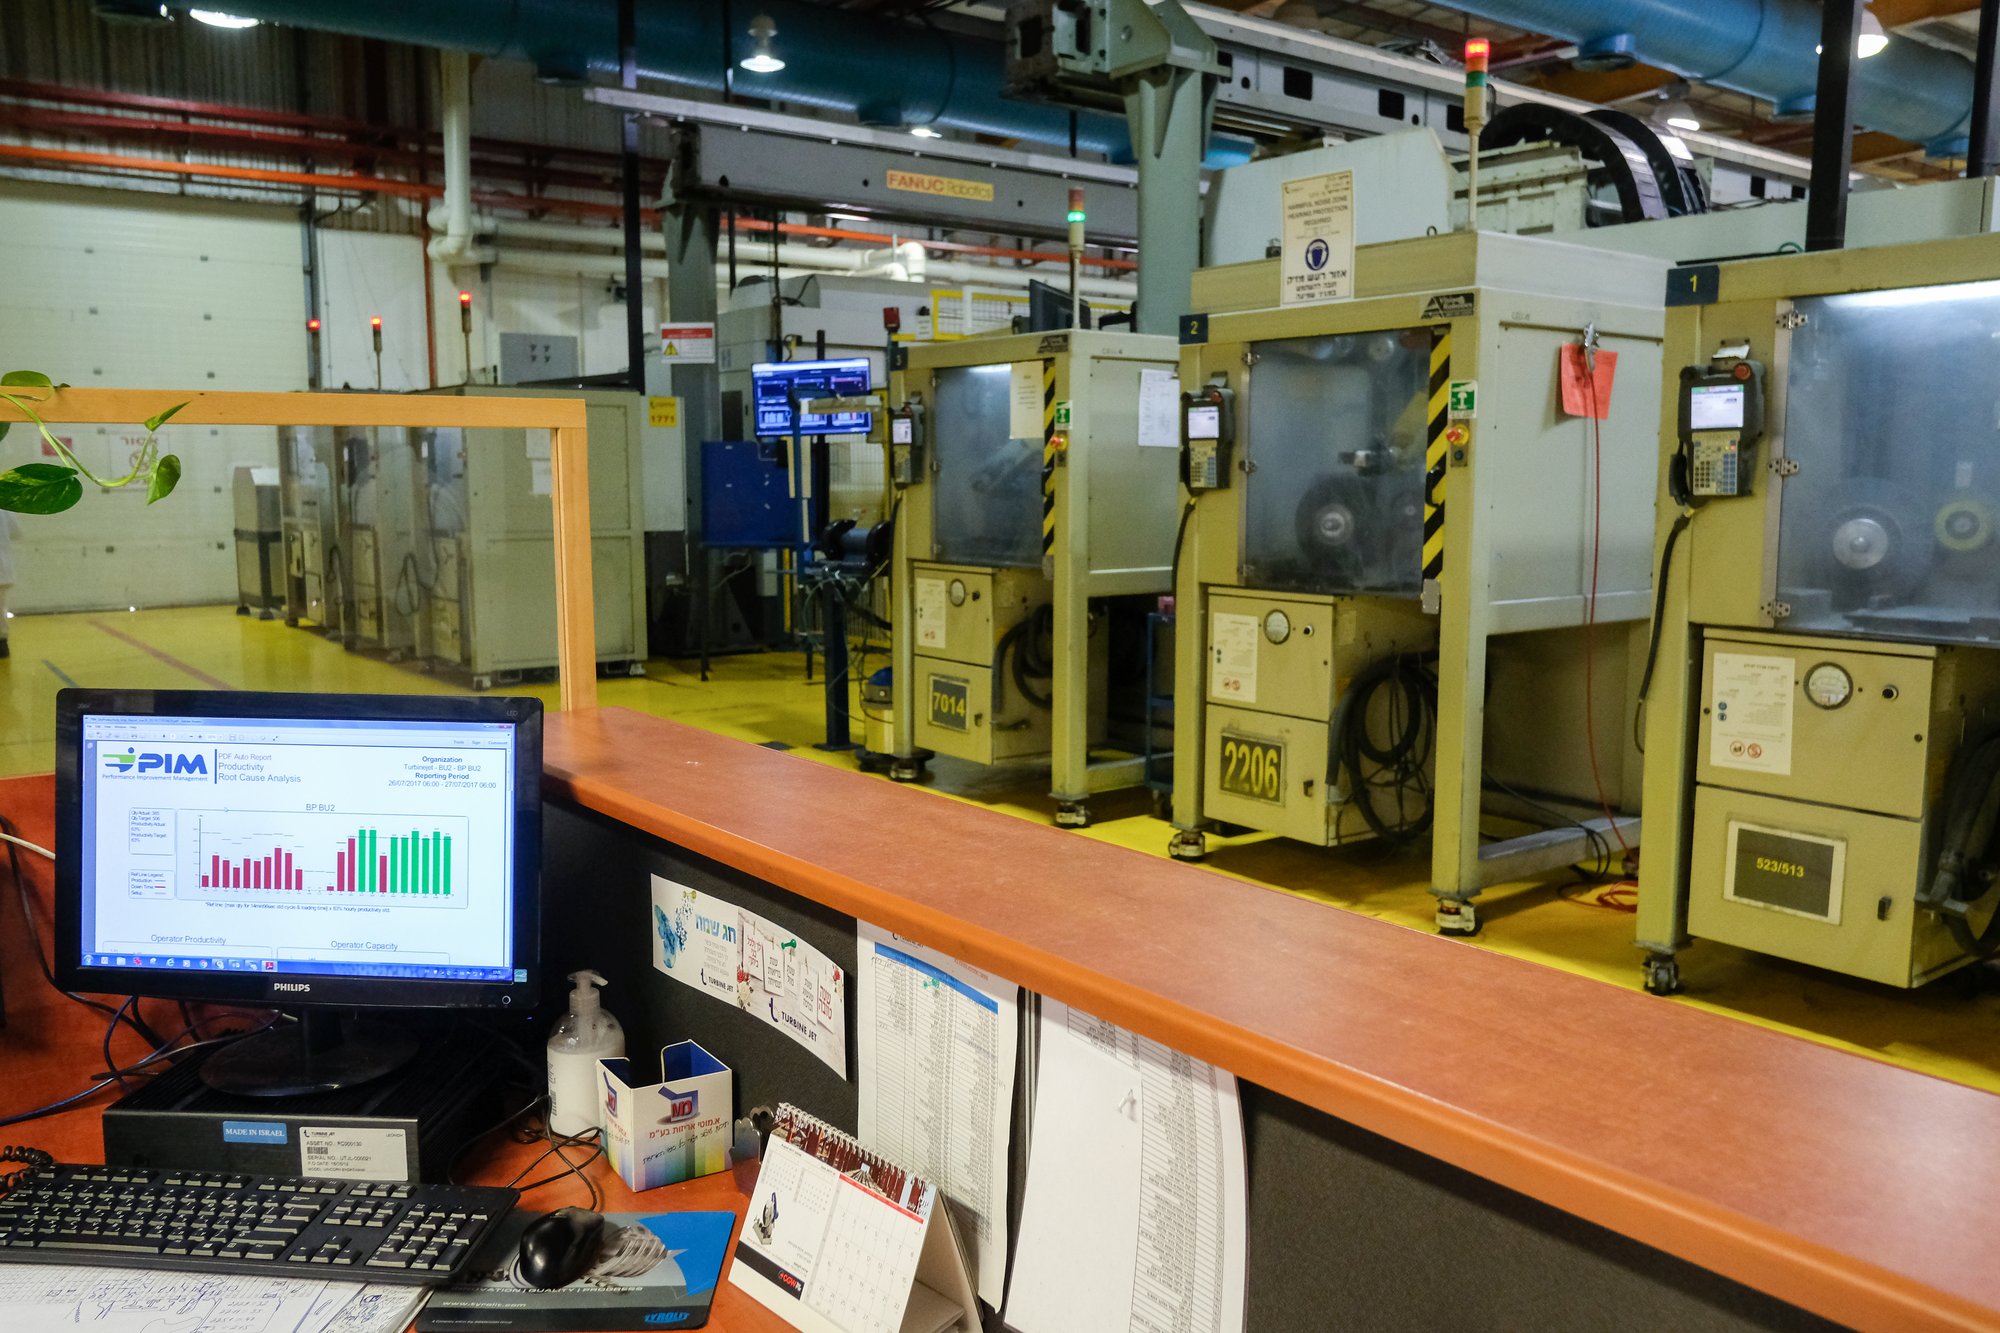
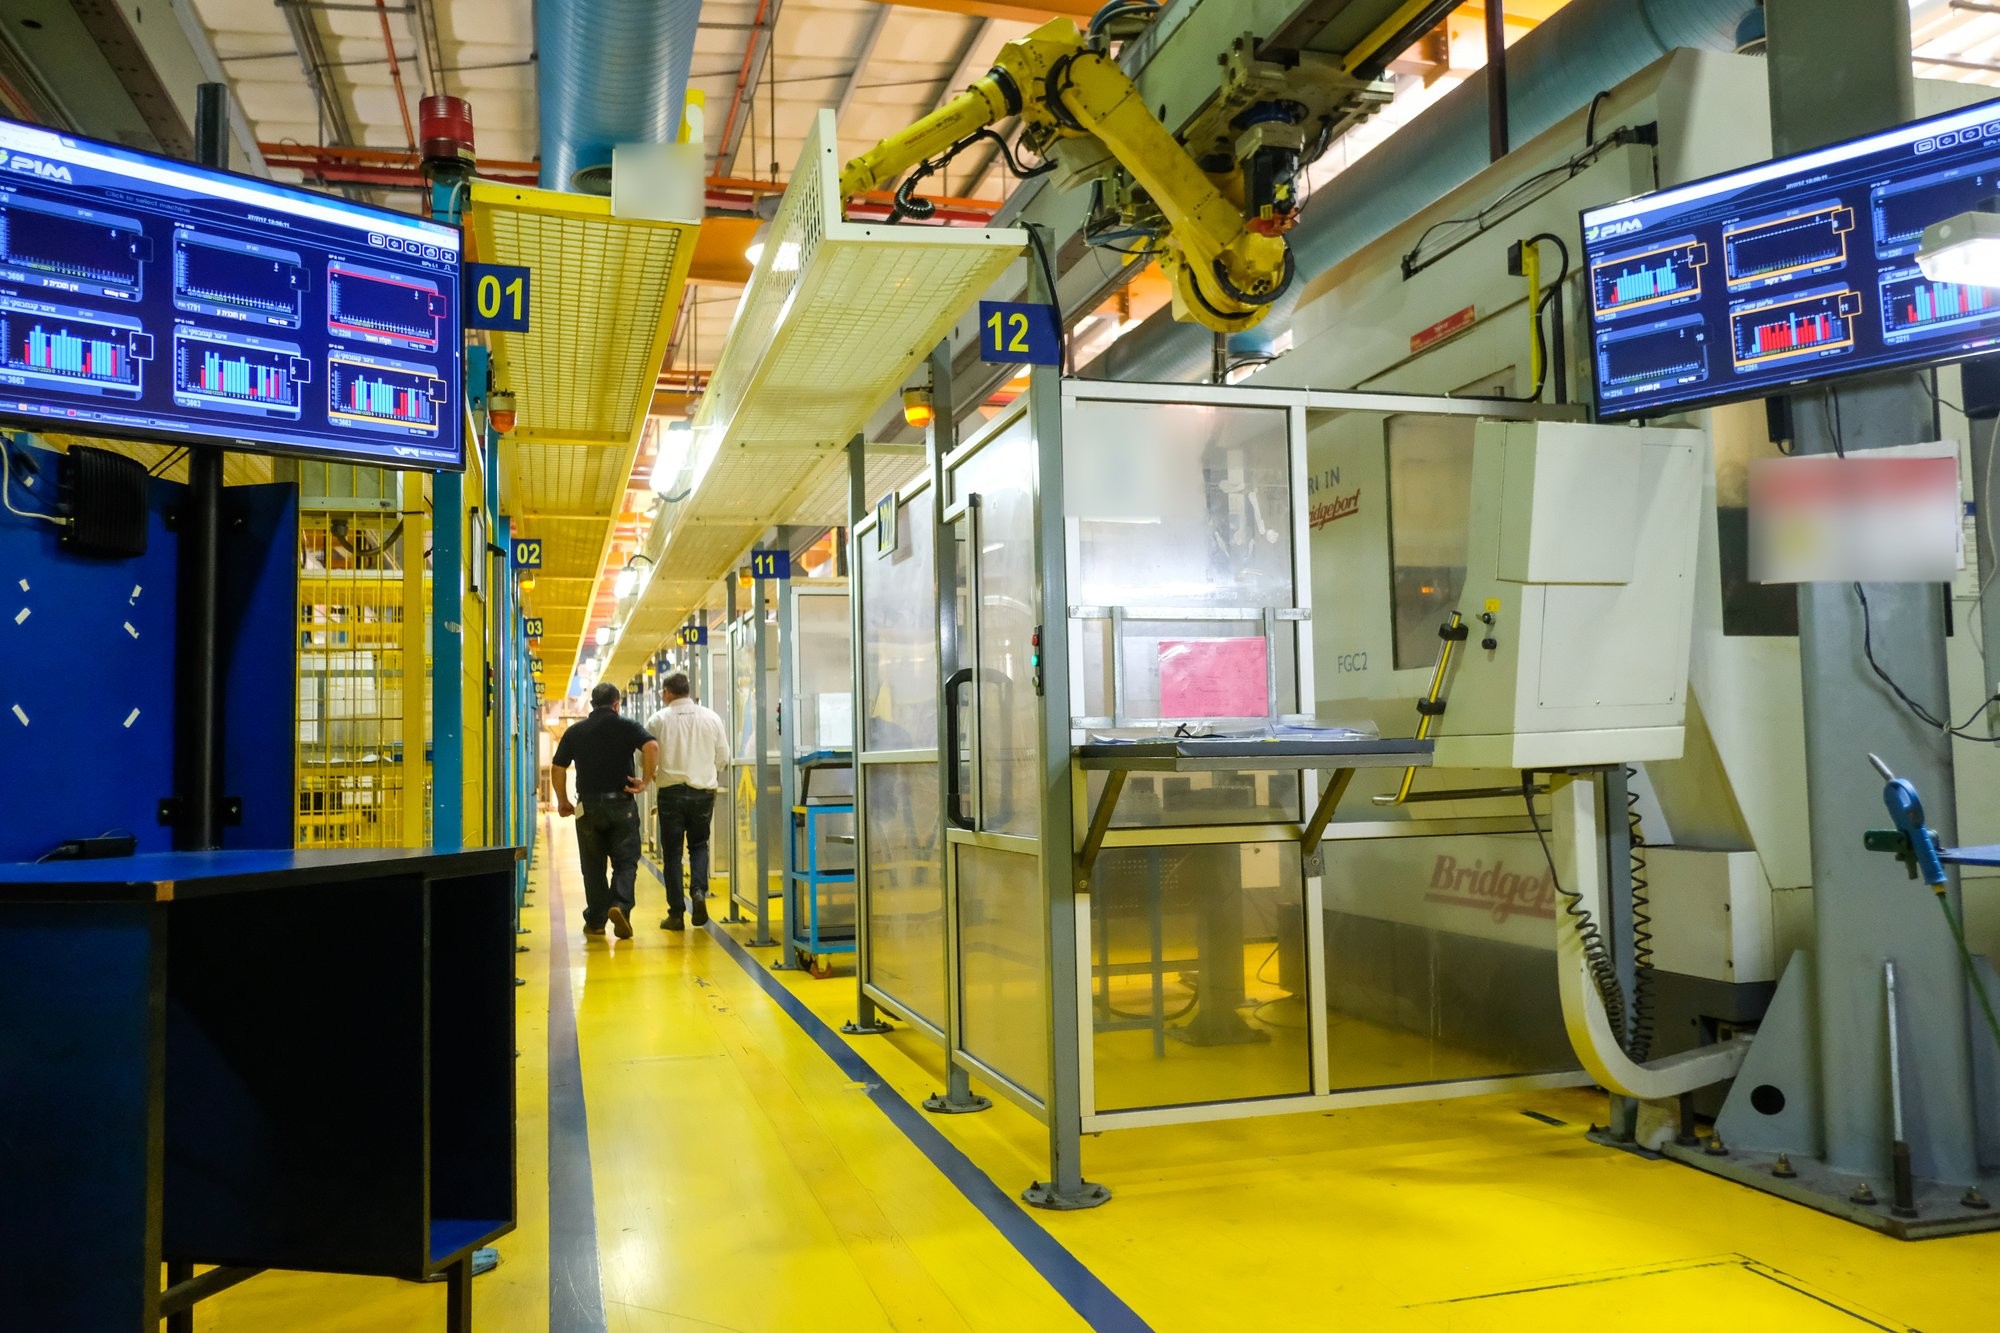
Eissmann's Pell City plant had no reliable view of what its machines did. It connected them to Visual Factories — its own engineering and maintenance people installed the IoT devices, no PLC changes, no training course. Within eight months OEE went from 59% to 75%, machine uptime from 80% to 92%, production per day rose 23%, overtime fell 63%, defects per million fell 68%, and the plant moved from three shifts to two.
The problem: a plant in the dark
Eissmann Group Automotive is a multinational Tier-1 supplier — shifter modules, trim components and complete interiors for virtually every well-known car maker. Its plant in Pell City, Alabama, had good machines and experienced people, and no reliable picture of what those machines did all day. The team knew the lines were not running as efficiently as they could; nobody could say by how much, or why.
The plant decided to measure instead of estimate. Visual Factories IoT devices were attached to all critical machines — by the plant’s own engineering and maintenance personnel, in a matter of days. No PLC changes, no network project, no training course.
What the machines said
From the minute the devices were live, the platform began collecting machine activity and highlighting the plant’s main inefficiencies. Managers and staff received alerts in real time as losses occurred; daily, weekly and monthly root-cause reports followed, with the data behind them, an ROI calculation and recommended corrective actions.
“Visual Factories’ simplicity and compatibility enabled us to connect all our machines on our own, and start monitoring and analyzing our performance in a matter of days.”John Medley, Head of Engineering & Maintenance, Eissmann Automotive, Pell City
Eight months later: the numbers
Between January and August, addressing the losses the platform made visible, the plant achieved more with less:
- OEE 59% → 75% (+27%)
- Machine uptime 80% → 92%
- Production quantity per day +23%
- Shifts per day 3 → 2 — the same output with one shift fewer
- Overtime −63%
- Defect parts per million −68%; scrap rate −43%
- Labour cost as a share of sales −20%; full-time equivalents −16%
More parts in less time, with fewer manpower hours, less overtime and less waste — and a plant that now runs on numbers it trusts.
Why it worked
Compatible with every machine. The IoT devices read the machine’s electrical signals, so they fit any machine regardless of its age, the process it runs or the PLC it has.
Plug and play. The plant’s maintenance and engineering people installed and configured the devices themselves; no integration, no IT project.
No training needed. Data collection is automatic. Operations personnel started capturing relevant machine activity from the first day without configuring anything or intervening in the collection.
Immediate insights, alerts and reports. Inefficiencies were visible from the first hours; alerts reached people as things happened; the daily PDF gave every review a starting point nobody argued with.
“Visual Factories is one of the best investments I made in my entire 25 years in manufacturing.”Tracy Breeding, Managing Director, Eissmann Automotive, Pell City, Alabama
What we learned
Pell City was not short of capacity. It was short of a number nobody could argue with. Once the number came from the machine, the plant found the third shift inside the first two — and closed it.
Nothing here required IT, integration or a course. The plant’s own people, the devices and one daily report did it. That is by design: the OEE Improvement product exists to make this the normal outcome, not the exception.
Questions people ask
Was anything changed on the machines or the PLC?
No. The devices read electrical signals only — running, stopped, cycle, count. No connection to the control, no change to programs, no access to part data.
Who installed the devices?
Eissmann's own engineering and maintenance personnel, with the plug-and-play configuration tool. The plant was monitoring and analysing its performance in a matter of days.
Are these results typical?
The pattern is typical — unlogged stops, long changeovers and shift differences are the losses we find in most discrete plants. The size of the gain depends on how much of the loss the plant chooses to close; Pell City closed a lot of it.