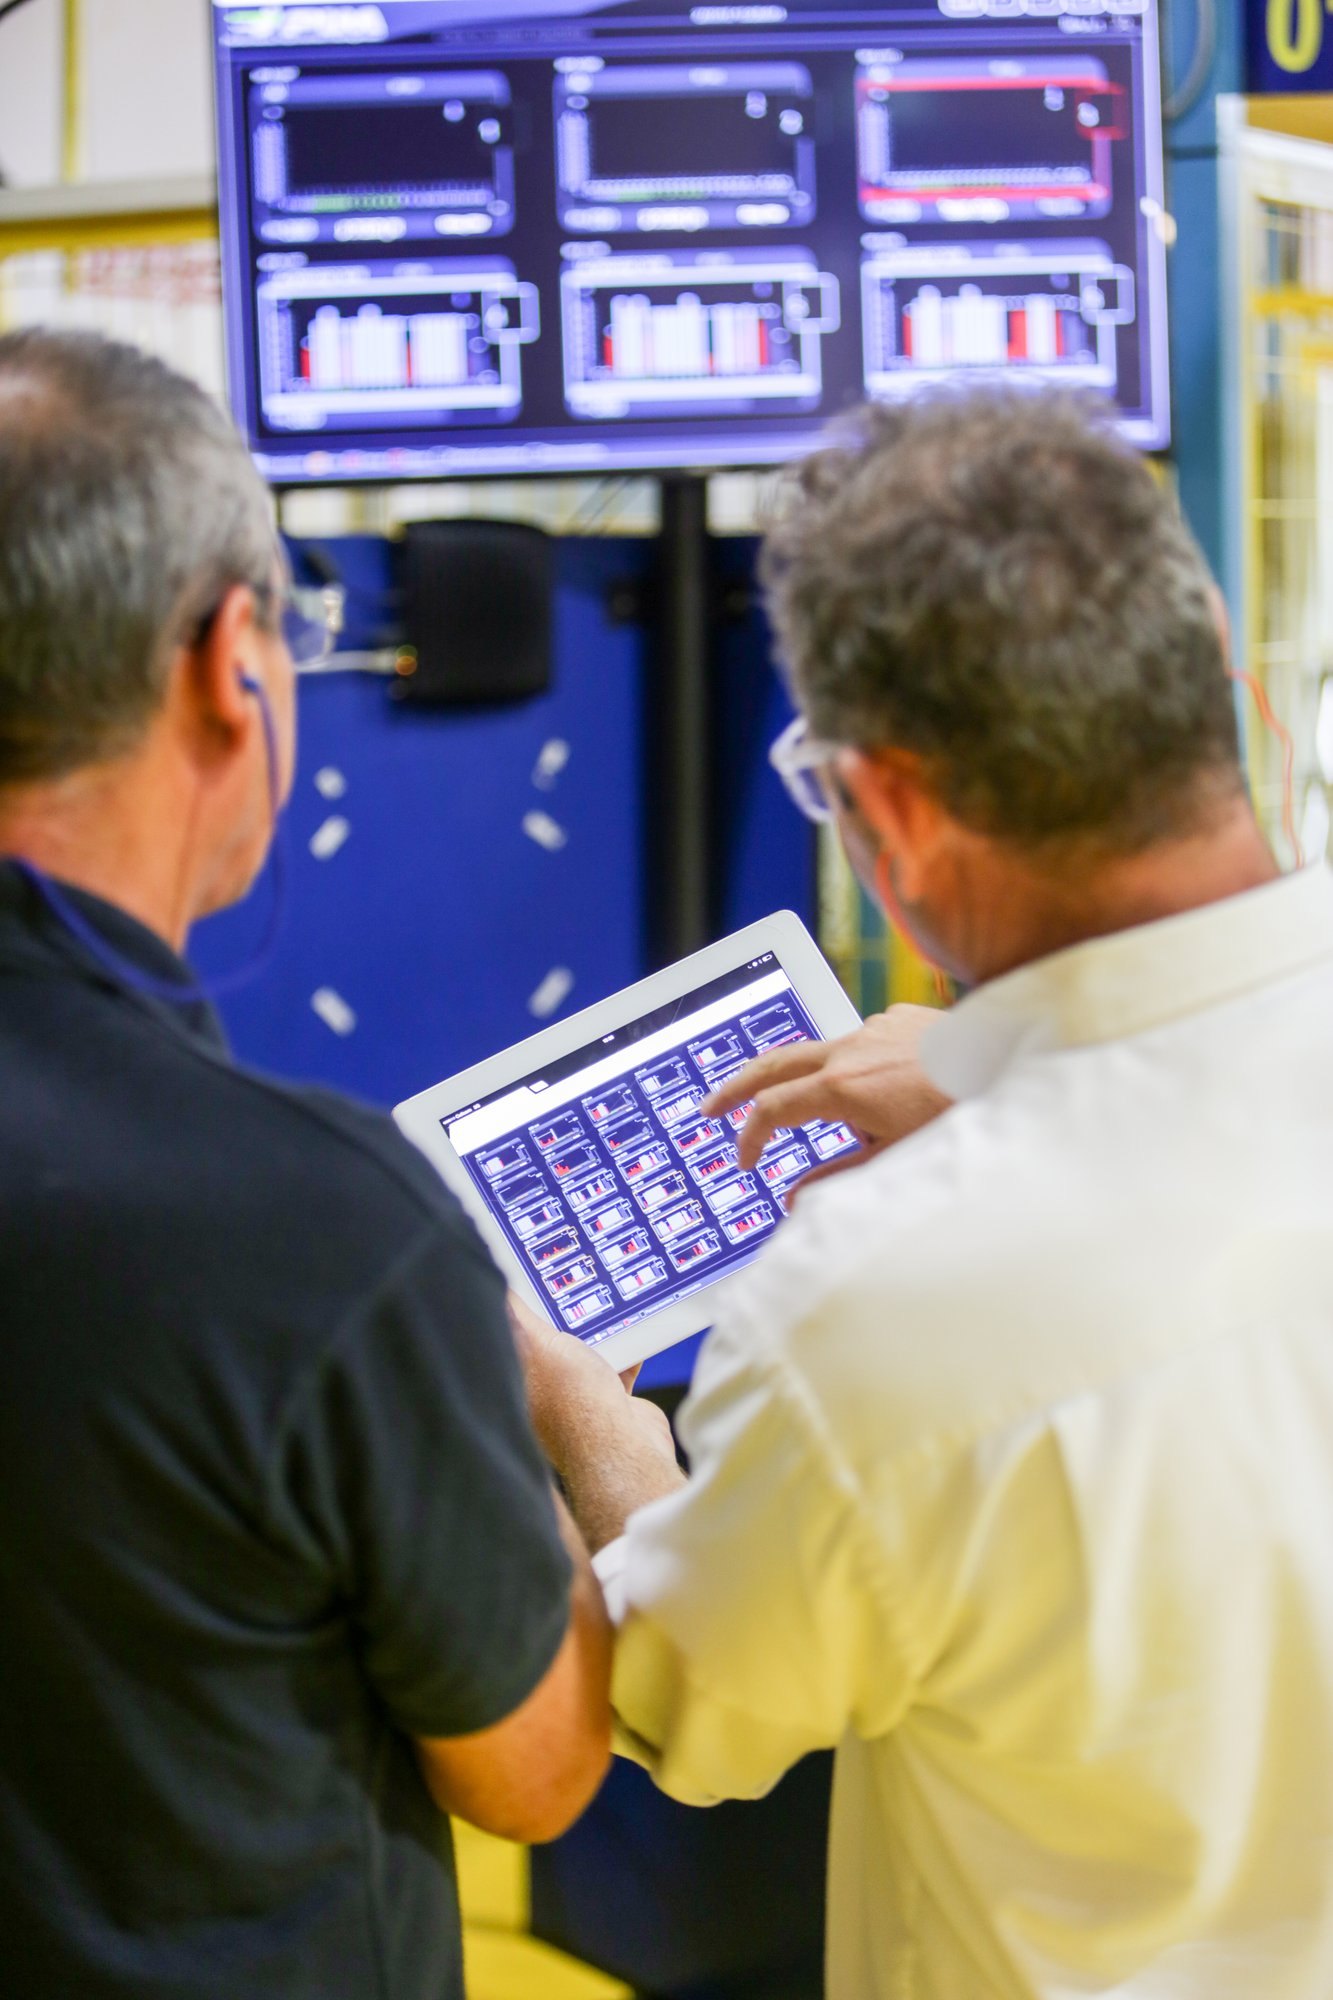
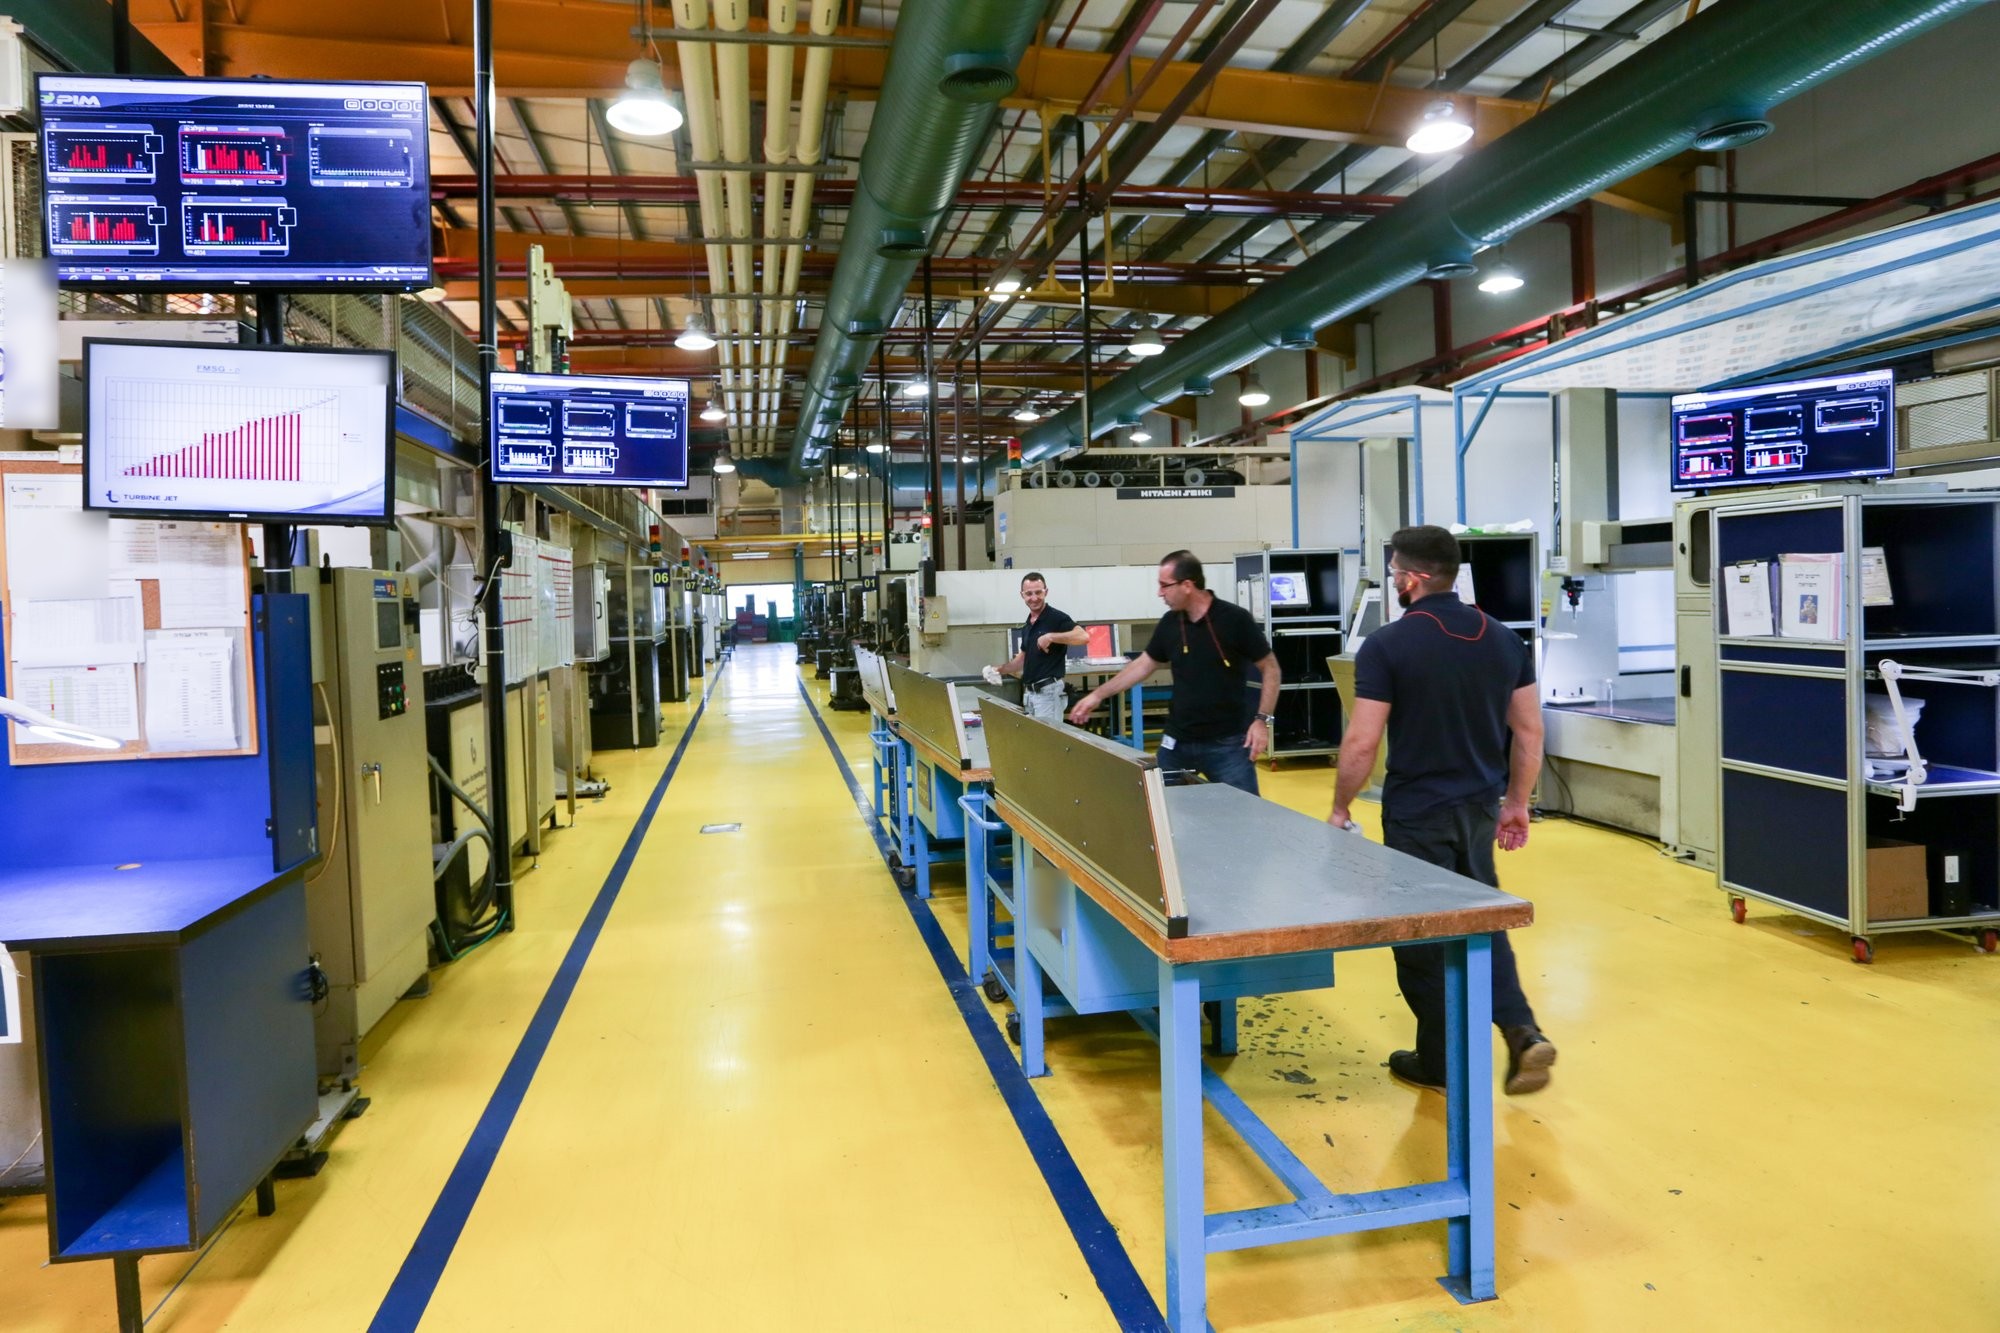
A machine rarely fails without warning: more short stops, a slowly stretching cycle, a falling count per hour on one machine while its neighbours hold steady. Those signs sit in the same four signals that run OEE, read by a small IoT device an electrician installs in under an hour with no PLC connection. Measured per machine, MTBF and MTTR rank the fleet; operators tag stop reasons in one tap; wear parts are counted in real cycles. The CMMS stays the system of record; Visual Factories adds the system of condition.
The calendar does not know what the machine did this month
Most preventive maintenance in the plants we connect runs on a calendar. Every press, every machining centre, every moulding machine gets its interval, and the interval is the same whether the machine sat idle for two weeks or ran three shifts with a difficult part. The maintenance manager knows this is wrong, and usually says so. What is missing is the number that would allow a different decision: how many hours and cycles each machine really ran since the last service, and how it behaved while running.
So the schedule stays. Some machines are serviced too early, which costs a planned stop and a set of parts that still had life in them. Others are serviced too late, which costs a breakdown. And when the breakdown comes, the downtime is logged as “mechanical”, the fix lives in the technician’s head, and the next stop on that machine is a surprise again.
What the signals say in the days before a stop
A machine rarely fails without warning. In our experience the warning is already in data the plant could be collecting: the stops get shorter and more frequent, the cycle slowly stretches, the count per hour drifts down on one machine while its neighbours hold steady. Operators often feel it before anyone can prove it. The problem is that nobody is looking at that machine’s behaviour day by day, so the pattern is recognised only after the breakdown, when it can be explained but no longer prevented.
The connection is simpler than most plants expect. A small IoT device is wired to the machine’s electrical signals; an electrician installs it in under an hour, with no PLC connection and no change to the programs, and the plant’s own people can do it. The signals are the same on every machine: running, stopped, cycle, count. What differs is the machine, the process, the product and the operating environment, even for two presses standing side by side. The Universal Adapter, in the cloud, interprets those same signals with the context of that specific machine, so a cycle that is normal on one press reads as a slowdown on the other.
Once the signals are flowing, the drift becomes visible. A rising number of short stops on a machine that used to run clean, a cycle time creeping up a few percent over a week, breakdown minutes climbing on one machine while the rest of the line is stable: these are the days of warning the calendar cannot see. The trend does not say which bearing is going. It says which machine to look at this week, and in our experience that is usually enough.
MTBF and MTTR per machine, measured rather than estimated
Most plants we visit can quote an MTBF for the plant, calculated at month-end from the breakdown log. Few can quote it per machine, and fewer trust the number, because the log depends on what was written down. When the same figures are measured from the machine’s own running and stopped signals, two things change. The number is per machine and it is live, so the maintenance manager can rank the fleet and work the worst machine first. And MTTR becomes an honest measure of how long a breakdown really lasts, from the moment the machine stopped to the moment it ran again, not from the moment somebody opened a work order.
The reason behind each stop still has to come from the floor. The most practical way we have seen is one tap by the operator on the floor monitor, from a short list of reasons the plant defined itself. The ranking is then done for the maintenance team: which reasons cost the most minutes, on which machines, including the micro-stops that never appear in a Pareto built from the breakdown log. “Mechanical” stops being a reason and becomes a dozen specific ones, each with a machine and a history. That is what the Condition-Based Maintenance product is built around: reliability measured per machine, reasons captured where they happen, and a task created from the finding with an owner and a date.
Wear parts counted in cycles, not weeks
Bearings, filters, belts, seals and lubricants have a life, and the supplier states it in hours or cycles. The plant then converts it into weeks, because weeks are what a calendar understands. The conversion assumes an average load the machine may never see. A machine that ran weekends uses up its filter in half the time; a machine that waited for material uses almost none of it.
Because the device already counts cycles and running hours, the same connection can count each wear part against the machine’s real use. The alert arrives on the floor monitor and on the phone while a planned stop is still ahead, so the change goes into the shift plan instead of becoming a breakdown at two in the morning. The plants we connect usually start with the three or four parts that caused the most breakdowns in the last year, not with the whole parts list.
Where the CMMS stays
None of this replaces the maintenance system the plant already runs. A CMMS is the system of record: the asset registry, the PM calendar, the spare parts, the work orders, the history an auditor will ask for. What the machine signals add is a system of condition: what each machine is doing now, why it stopped, and what should be done about it, with the evidence attached. The finding becomes a task with an owner, a priority and a due date, worked from the phone and closed when done, or pushed into the CMMS as a work order. A daily PDF to the maintenance manager says what happened and what is still open.
Whether the work was right is also measured, not argued. After the fix, the machine’s own MTBF and MTTR show whether the problem is gone. If the short stops come back a week later, the task is reopened with the data, not with an opinion.
What we learned
The pattern before a breakdown is usually there days earlier, in the same four signals that run OEE; the plant was simply not looking at that machine. Per-machine MTBF and MTTR are worth more than a plant-wide figure, because they tell the maintenance manager where to start. Reasons tagged by the operator in one tap beat a breakdown log written at the end of the shift. Wear parts counted in real cycles turn surprise stops into planned ones. And the CMMS keeps its job; it just stops being the only place the maintenance team looks.
If you want to know what your worst machine has been saying, tell us which one it is, and we will show you how it would be connected and what the first two weeks usually reveal.
Questions people ask
What is condition-based maintenance in practice?
Maintenance triggered by what the machine actually did and how it is behaving, rather than by a fixed calendar interval. In practice it means per-machine MTBF and MTTR, stop reasons captured on the floor, and wear parts counted in real cycles or hours, so service happens when the machine needs it.
Do I need new sensors or a PLC connection to start?
No. A small IoT device wired to the machine's electrical signals by the plant's own electrician, in under an hour, provides the running, stopped, cycle and count signals. There is no PLC connection and no change to the programs. The Universal Adapter in the cloud interprets those same signals with the context of each specific machine.
Does this replace our CMMS?
No. The CMMS remains the system of record for assets, the PM calendar, spare parts and work orders. Visual Factories adds the system of condition: live reliability per machine, reasons from the floor, and tasks with owners that can be pushed into the CMMS as work orders.