






Industries

Any discrete plant.
Any machine.
Same losses, measured.

Automotive, aerospace, electronics, medical devices — even food & beverage lines. The machines differ; the losses do not: micro-stops, slow cycles, changeovers, tools that run past their life, breakdowns nobody explained. Visual Factories reads any machine from its electrical signals, so every discrete plant gets the same loop: measure, find the cause, assign the task, prove the gain.

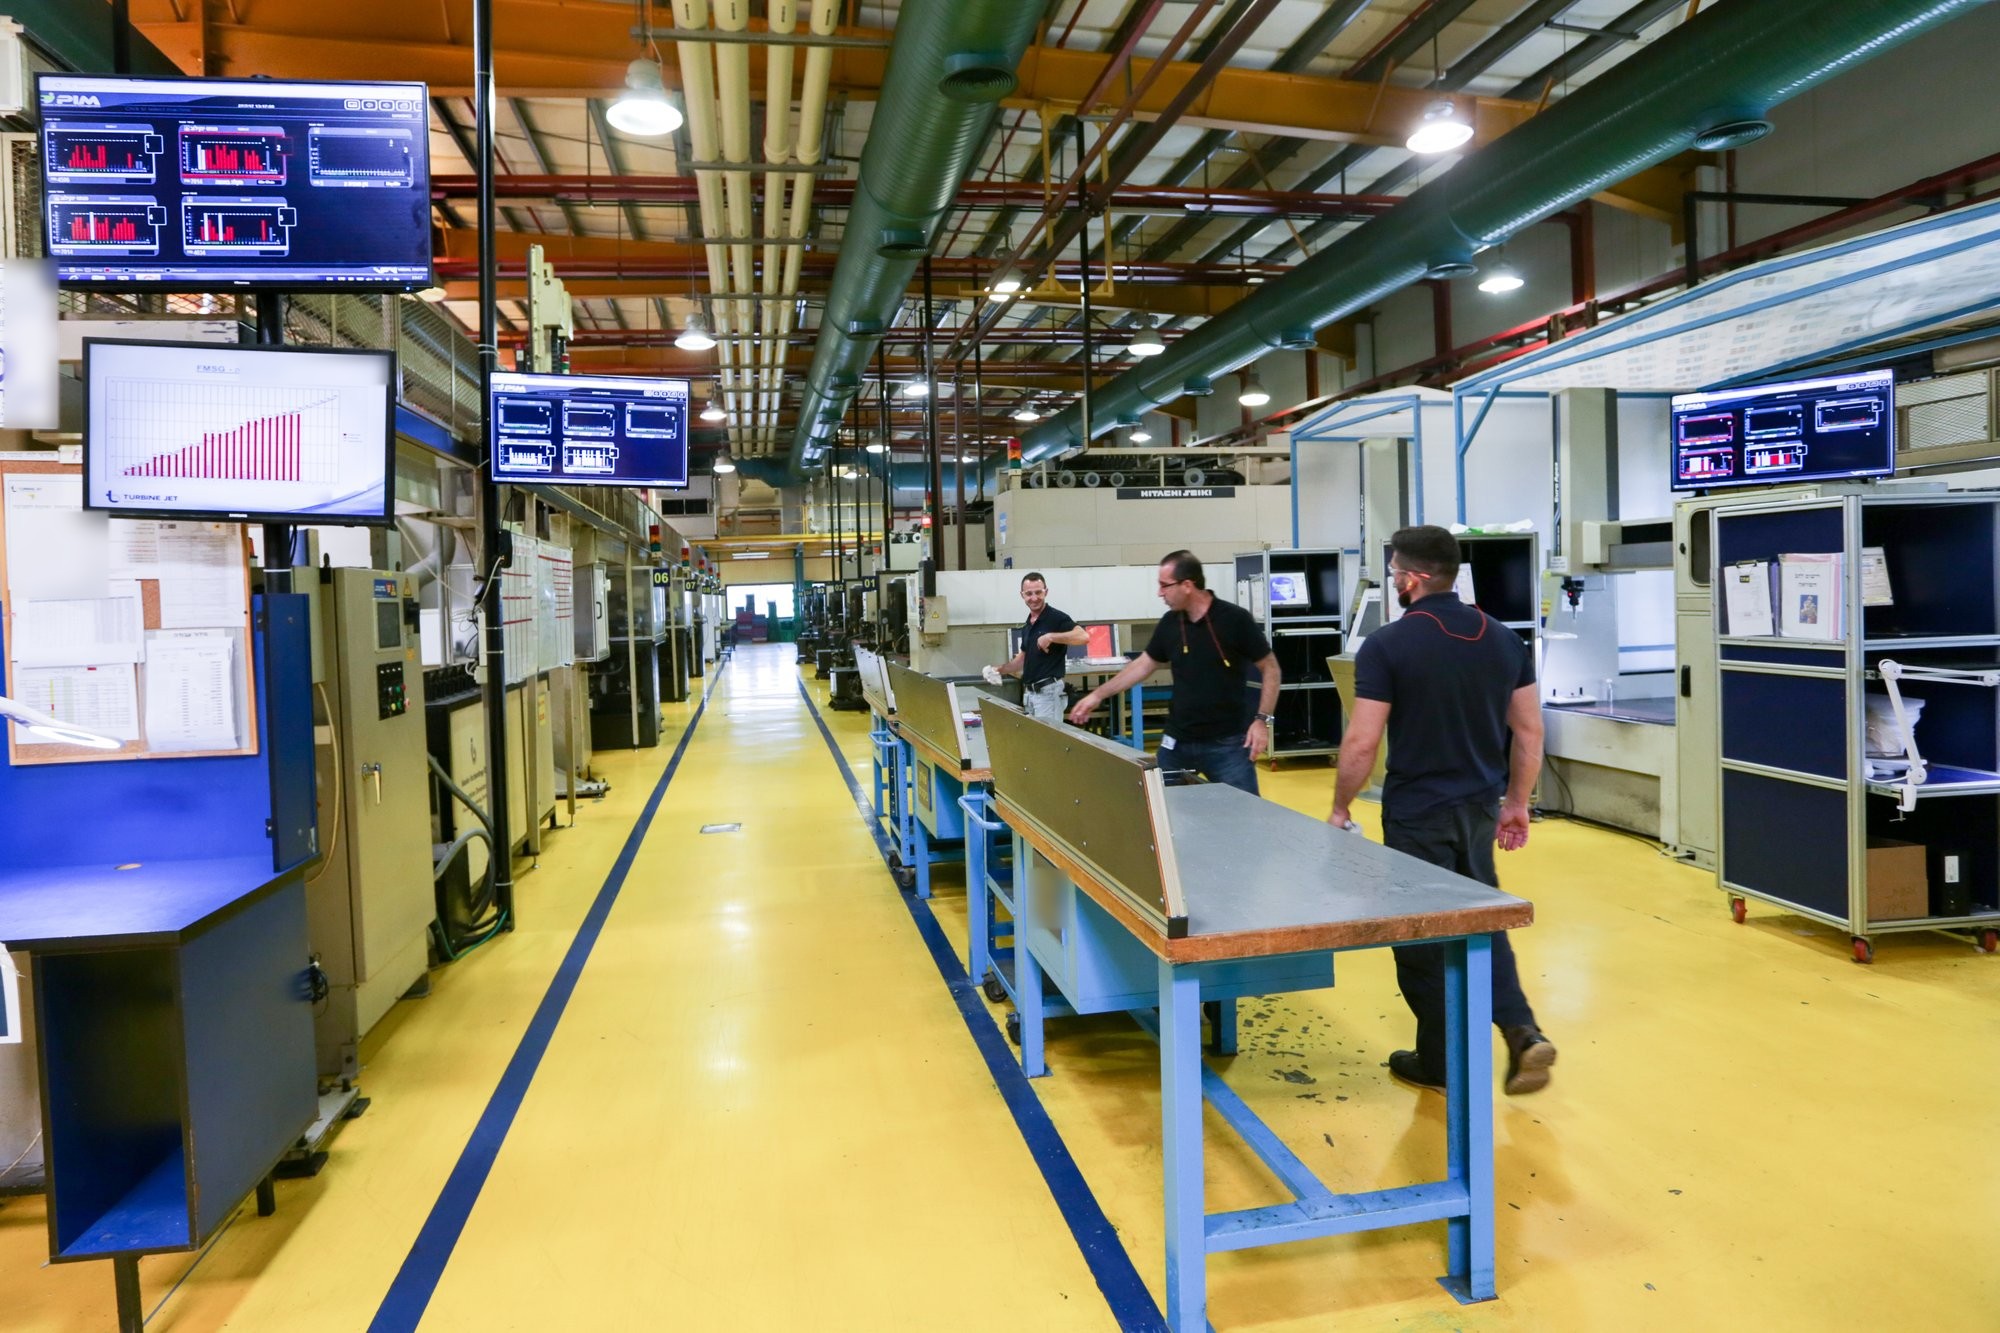
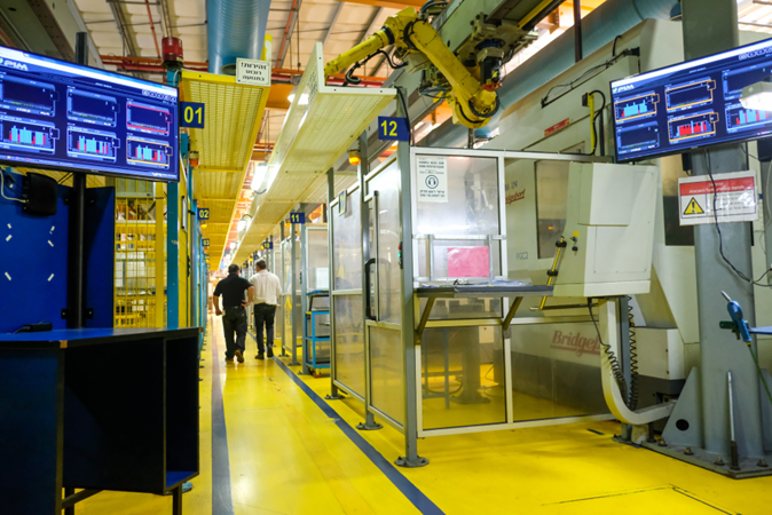
Production floor with Visual Factories monitors above every cell
Any machineany age, any control
14 daysto a live, measured plant
No IT projectconnected by an electrician
Rolls-RoycePratt & WhitneyGühringDinexTecvoxTrinityRailTAV Medical
Who we serve

Reference plants in every discrete industry we serve.

Discrete manufacturing is any plant that makes countable parts on machines with a cycle — molding, stamping, machining, assembly, packaging — as opposed to process industries such as chemicals or refining. We are agnostic to the machine and to the product. If a machine has a cycle, a stop and a reason, we measure it. Visual Factories runs today in automotive, aerospace, electronics, medical-device and food & beverage plants — and every one of them was losing the same capacity in the same places.

Automotive

Our focus
Tier-1 & Tier-2 suppliers · OEMs
Molding, stamping, machining, assembly, inspection and end-of-line stations

Leading automotive OEMs use Visual Factories for visibility into their supply chain; their suppliers run it on the floor to deliver on time, in full and fund the cost-down.

Aerospace

Machining · forging · grinding
Spindle uptime, tool life, traceability

Running at aerospace plants where every part is traceable and every tool change is a decision — cost per part, program control and machine uptime, measured from the machine.

Electronics

Assembly · SMT · welding · test
Micro-stops and takt on fast lines

Running at electronics plants where short cycles hide short stops. Counting every unit and every stop from the machine shows where a fast line loses a shift a week.

Medical Devices

Molding · machining · packaging
Consistency you can document

Running at medical-device plants: cycle-by-cycle records from the machine, every mold located and its shots counted, stop reasons tagged by the operator — evidence for the audit from the same connection that runs OEE.

Food & Beverage

Filling · packaging · processing lines
Line OEE and changeover time

Running on food & beverage lines: fillers, cappers and packers stop for the same reasons as presses do. Measured per machine, the bottleneck and the changeover loss stop being a guess.

Multi-plant corporations

Plants in several countries
One unified view across the globe

Self-installed by each plant's electrician and agnostic to the machine, so plants in different countries connect the same way in weeks — and headquarters sees every plant, line and machine on one standard. Metal, plastics, wood, rail, defense: if it has a cycle, we measure it.

In every industry above, Scheduling & Dispatching and Condition-Based Maintenance run alongside OEE Improvement on the same connection — one device per machine, installed by your electrician.

The same losses, every industry

Different products. Identical losses.

Across every discrete plant we have connected, the capacity was lost in the same three places — and the end-of-shift report never showed them.

01

Micro-stops and slow cycles

Thirty-second stops and cycles a few seconds long never get written down. Added up, they are a shift a week per line.

02

Changeovers, start-ups, tools

Setup time, the first hour of a shift and tools run past their life — the losses between the losses.

03

Breakdowns nobody explained

Downtime logged as "mechanical". The pattern that preceded it was never captured, so the next one is a surprise again.

The machine already knows why it stopped. Every industry, the job is the same: measure it, name it, fix it, prove it.
Our focus

In recent years our focus has moved to automotive.

Leading automotive OEMs use Visual Factories for visibility into their supply chain — they nominate the supplier cells that gate a launch, and those cells report themselves. Their Tier-1 and Tier-2 suppliers run the same platform on the floor to deliver on time, in full, fund the yearly cost-down and answer the OEM review with facts.

The rest of this page is written for automotive suppliers. If you are an OEM, the supply-chain program is on its own page.

59→75%OEE, Tier-1 supplier plant, eight months
+23%output per day on the same machines
−63%overtime hours
3 → 2shifts for the same output
The automotive squeeze

The cost-down is signed. The losses that pay for it are invisible.

Every year the OEM takes a few percent off the price. Every year the plant is asked to find it. The capacity is there — it is lost in micro-stops, slow cycles, changeovers and start-ups that never reach the end-of-shift report — so the plant pays for it with overtime and an extra shift instead.

01

Overtime and extra shifts cover hidden losses

Paper OEE says 75%. The machines say 59%. The gap is paid every month in overtime, weekend shifts and expedited freight.

02

Launch ramps and OEM escalations

A new program ramps on the same machines as the running ones. When output slips, the OEM sees it before the plant does — and the escalation lands on the plant manager.

03

Improvement projects that fade

Kaizen weeks find the problem; nobody measures whether it stayed fixed. Six months later the same stop is back and the data to prove it was never collected.

The capacity you need for the cost-down is already on the floor. It only needs to be measured and worked.
What you get

Live truth per cell. Reasons ranked. Tasks closed.

One IoT device per machine, installed by your electrician. From then on every cell reports itself — and the AI agent tells you what to fix first.

01 · Live per cell

OEE, output and takt on the floor monitor

Operators see the cell status live; management sees every cell, plant by plant. Baseline measured from the machine, not from the report.

OEE Improvement →

02 · Reasons ranked by AI

The losses the Pareto misses

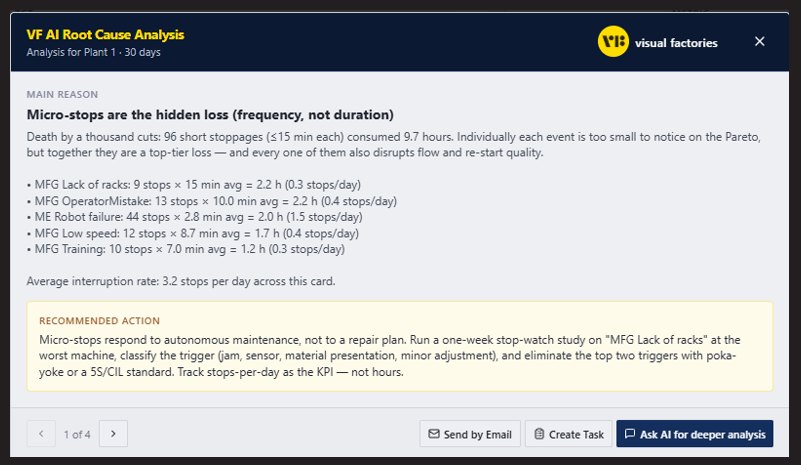
Operators tag stops in one tap. The AI agent ranks the causes by what they cost — including the micro-stops nobody records — and recommends the action.

See the AI root-cause agent →

03 · Daily proof

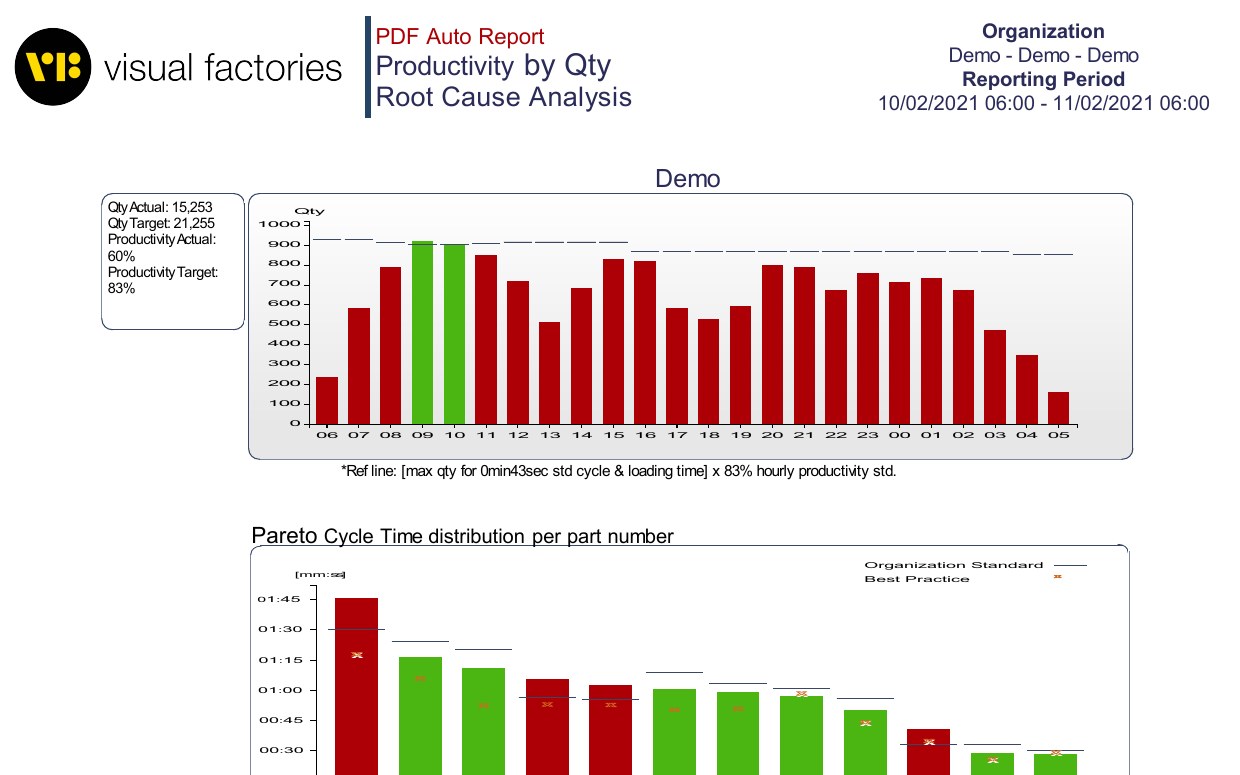
A PDF to the plant manager every morning

Output by cell, losses by reason, tasks open and closed. The same numbers the OEM asks for at the quarterly review — ready every day.

Scheduling & Dispatching →

Measured results — automotive

One Tier-1 plant. Eight months. Same machines, same people.

59% →
75% OEE

Plant-level OEE, eight months after connection

80% →
92% uptime

Availability across the connected lines

3 shifts →
2 shifts

Same output on two shifts; overtime −63%

Tier-1 automotive supplier, plant level. Baseline measured before connection; results verified against production data. Full figures in the case study.
49% →
62% OEE

13-machine machining cell — Tier-1 automotive supplier, Mexico

48% →
83% OEE

4-machine injection-molding cell — same plant

59% →
82% OEE

2-machine end-of-line cell — same plant

Three cells, three processes, measured Nov 2025 – Apr 2026.
Case study — Tier-1 automotive supplier
Case study · Tier-1 automotive supplier

Increasing revenue, cutting costs, and reducing overtime

  • +27%OEE
  • +23%production per day
  • −63%overtime hours
  • −68%defect parts per million
Read the case study PDF · free download
1
What it takes from you: one executive who makes sure people execute.

The system measures, analyzes and assigns. The only thing it cannot do is decide that improvement is a priority. Give the loop one owner with authority, and the results follow.

Where it applies

Every automotive process. One connection per machine.

Any machine, any age, any control: the IoT device reads the machine's electrical signals and the Universal Adapter in the cloud does the rest. Pick the process that hurts most and start there.

Injection Molding

Typical wins
Cycle time, changeovers, mold life

Shots counted per mold, slow cycles flagged live, every mold located and its tool life tracked from the machine counter.

Stamping & Presses

Typical wins
Micro-stops, die changes, strokes per hour

Strokes counted per press, stops tagged by the operator, die-change time measured against target — the losses between the big stops become visible.

CNC Machining

Typical wins
Tool life, program control, spindle uptime

Parts per tool counted automatically, programs uploaded and downloaded with traceability, condition-based maintenance from the machine's own signals.

Assembly, Inspection & End-of-Line

Typical wins
Takt adherence, starved and blocked stations

Units per hour against takt on the line monitor — assembly, inspection and test stations alike; where the line waits, and why, tagged live by the team.

Program Launches & Ramps

Typical wins
Ramp curve measured, not reported

The launch cell is connected before the start of production; the ramp is measured shift by shift and the OEM gets facts instead of promises.

Maintenance

Typical wins
MTBF, MTTR and wear parts per machine

Breakdowns explained by the reasons that preceded them; wear parts changed at a planned stop instead of a breakdown.

How it works

Connect. Measure. Improve. Prove.

Fourteen days from the first machine to a measured plant — then the loop runs every shift.

01 · Connect
Your electrician, under an hour per machine

The IoT device on the machine's electrical signals; the Universal Adapter in the cloud does the rest. No PLC project, no IT project.

02 · Measure
Baseline from the machine

OEE, output, takt and stops per cell, measured — not estimated — from day one.

03 · Improve
Reasons ranked, tasks assigned

The AI agent finds the top losses and creates tasks with an owner and a date. The floor closes them.

04 · Prove
Daily PDF, quarterly proof

The same numbers go to the plant manager every morning and to the OEM review every quarter.

Proven on the floor

The plant sees its own losses within two weeks.

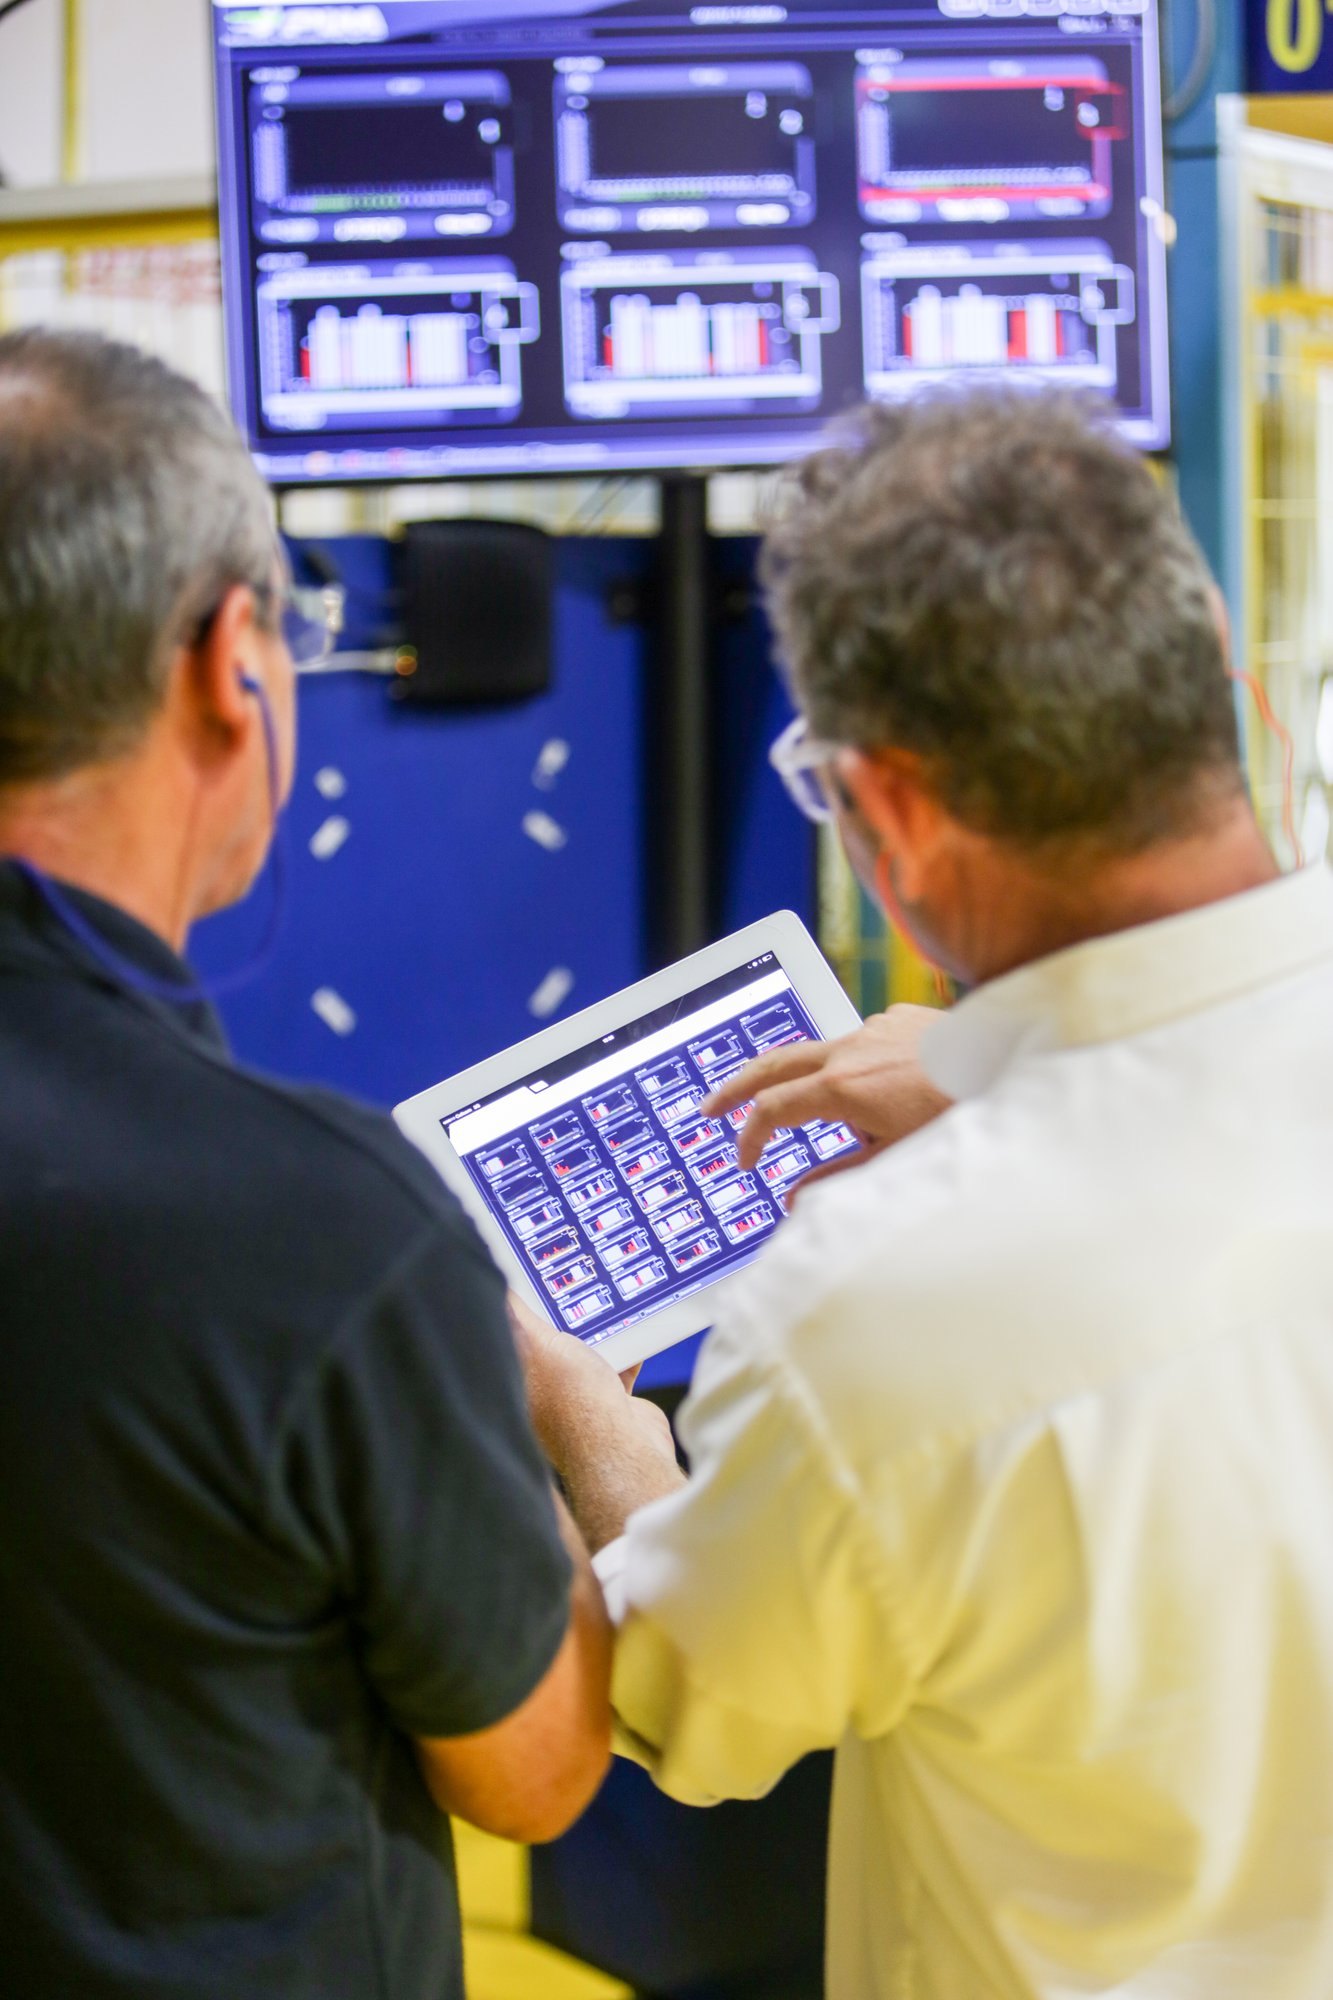
Managers see the losses on their own machines — which is why the cost-down stops being an argument and becomes a task list.

See the OEE Improvement application →
Managers reviewing Visual Factories data on a tablet
What changes

From paper OEE to measured OEE.

Today
  • OEE calculated at end of shift from what the operator wrote down
  • Overtime and an extra shift cover the losses nobody can name
  • The OEM hears about the problem before the plant does
  • Kaizen results fade because nobody measures whether they held
With Visual Factories
  • OEE, output and takt measured live from every machine
  • Losses ranked by cost; capacity recovered on the same machines
  • The plant shows the OEM facts — daily, per cell
  • Every improvement verified by the machine's own numbers
Who uses it
Plant manager
Owns the numbers

One daily PDF: output, losses, tasks. The cost-down becomes a list of causes with owners.

Production manager
Works the worst cell first

Live cell status; micro-stops and slow cycles visible the moment they start.

CI / Lean manager
Proves every kaizen

Baseline and after-measurement from the machine — no argument about whether it worked.

Quality & program managers
Ramps and escalations with evidence

Launch cells measured shift by shift; OEM reviews answered with data, not promises.

Free download

The automotive case study

How a Tier-1 automotive supplier lifted plant OEE from 59% to 75%, moved the same output from three shifts to two and cut overtime 63% in eight months — what was connected, what was found and what the teams did about it.

PDF · 4 pages · plant-level results


    Pick your worst cell. We measure it in two weeks.

    Connect one cell, get its real OEE, its top three losses and the first tasks — then decide. 14-day Activation Sprint with a money-back SLA, or a free POC first.

    ✓ 14-day Activation Sprint✓ Money-back SLA✓ ISO 27001✓ Proven at Tier-1 automotive plants
    Scroll to Top

    Schedule a Free Trial

    Please fill in your details so we can get in touch and start your free trial.