
More output.
Same floor.
4–12 weeks.
Visual Factories measures the real OEE of every machine, finds the losses that matter, and turns them into tasks people actually do. 20% OEE improvement in 4–12 weeks — verified on production data.
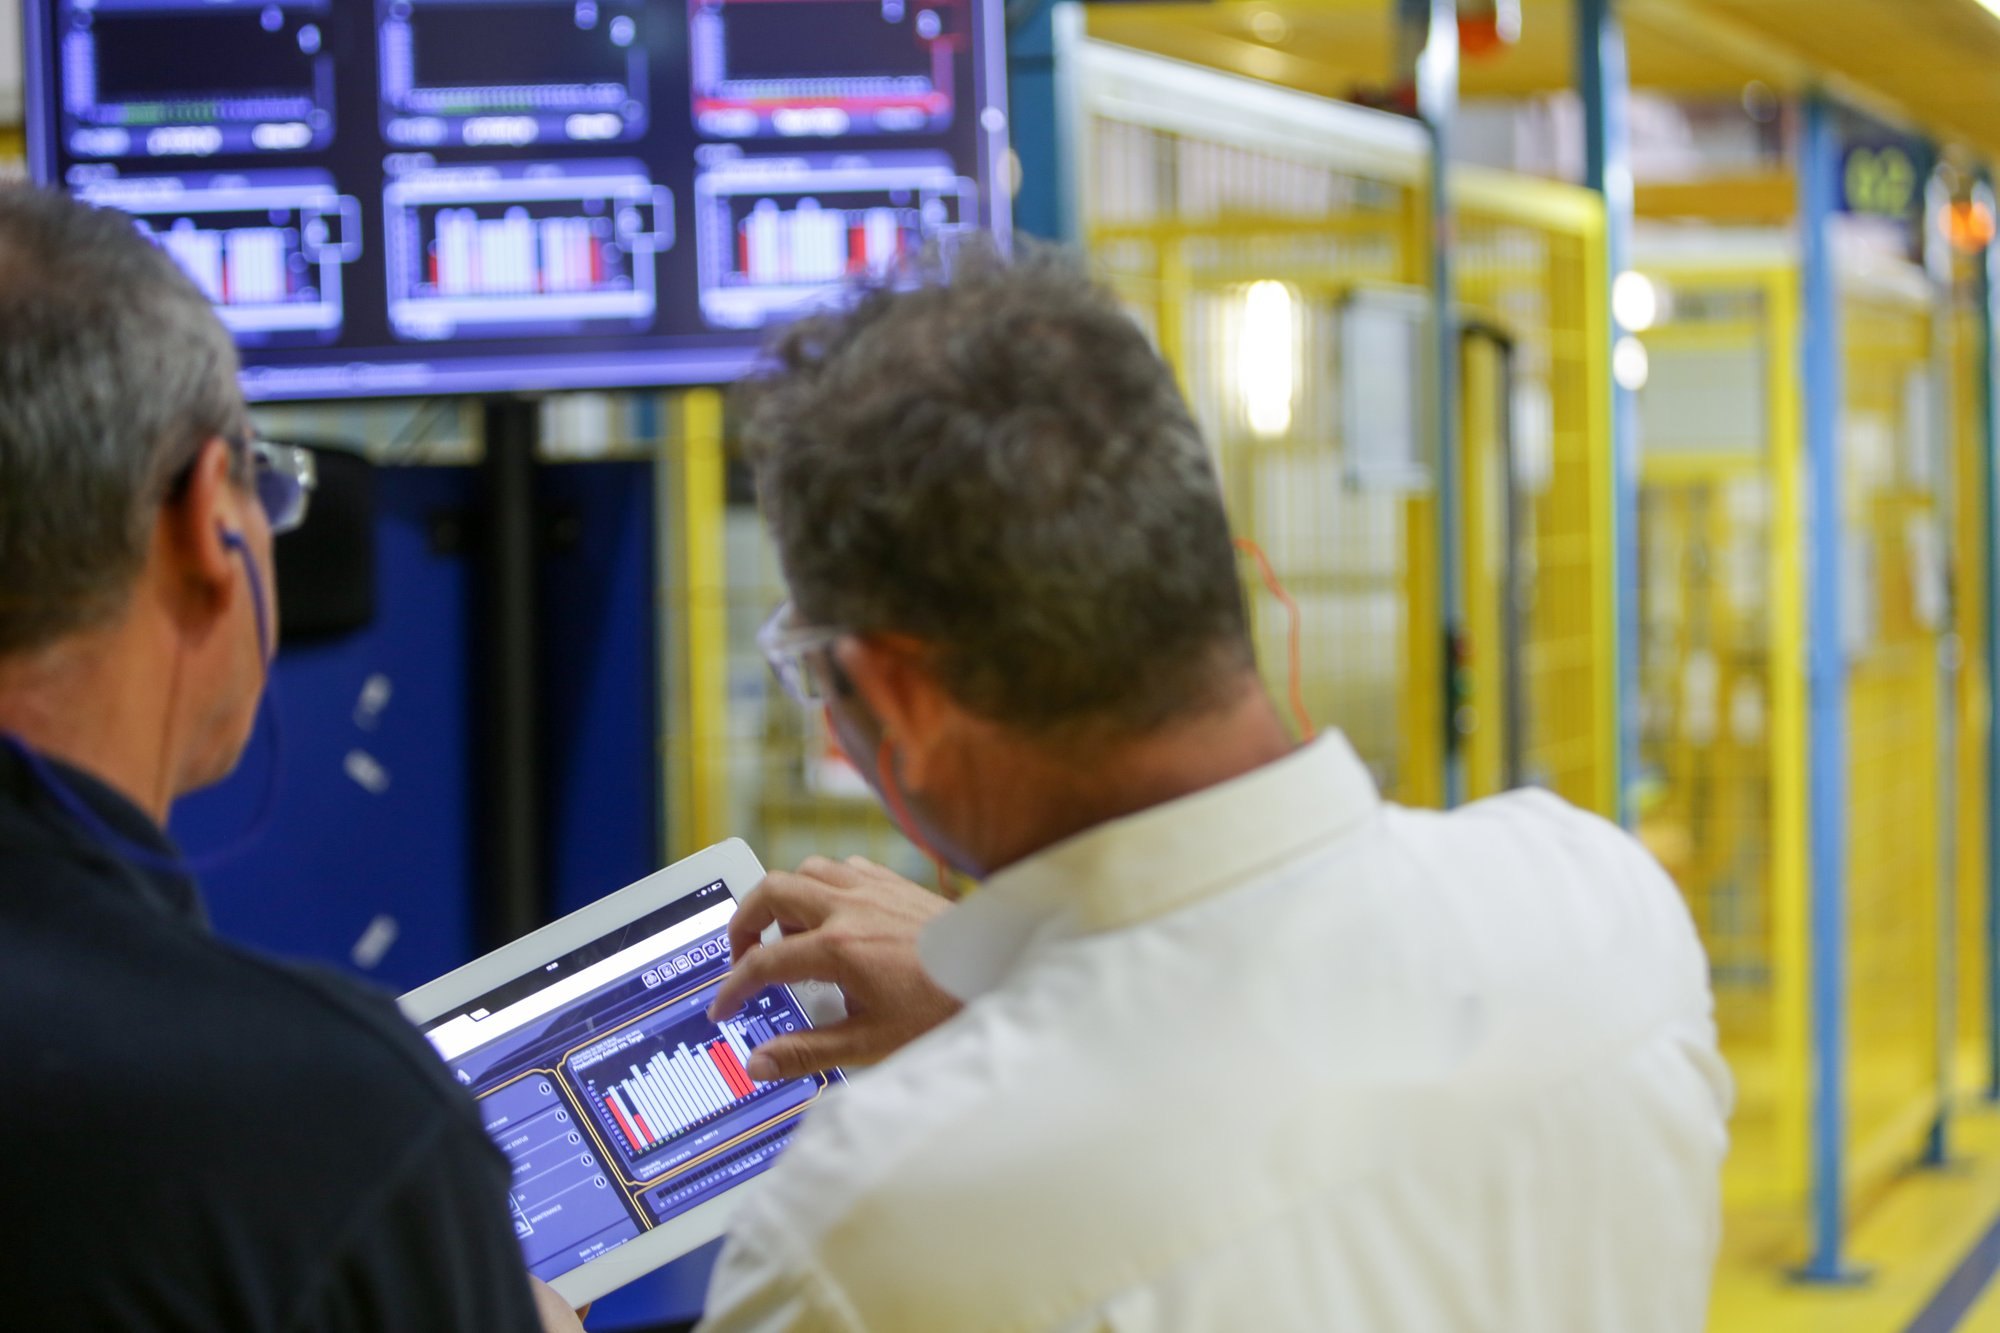






Real OEE on every machine — and the reason behind every loss.
From the day the machines are connected, without operators typing anything.
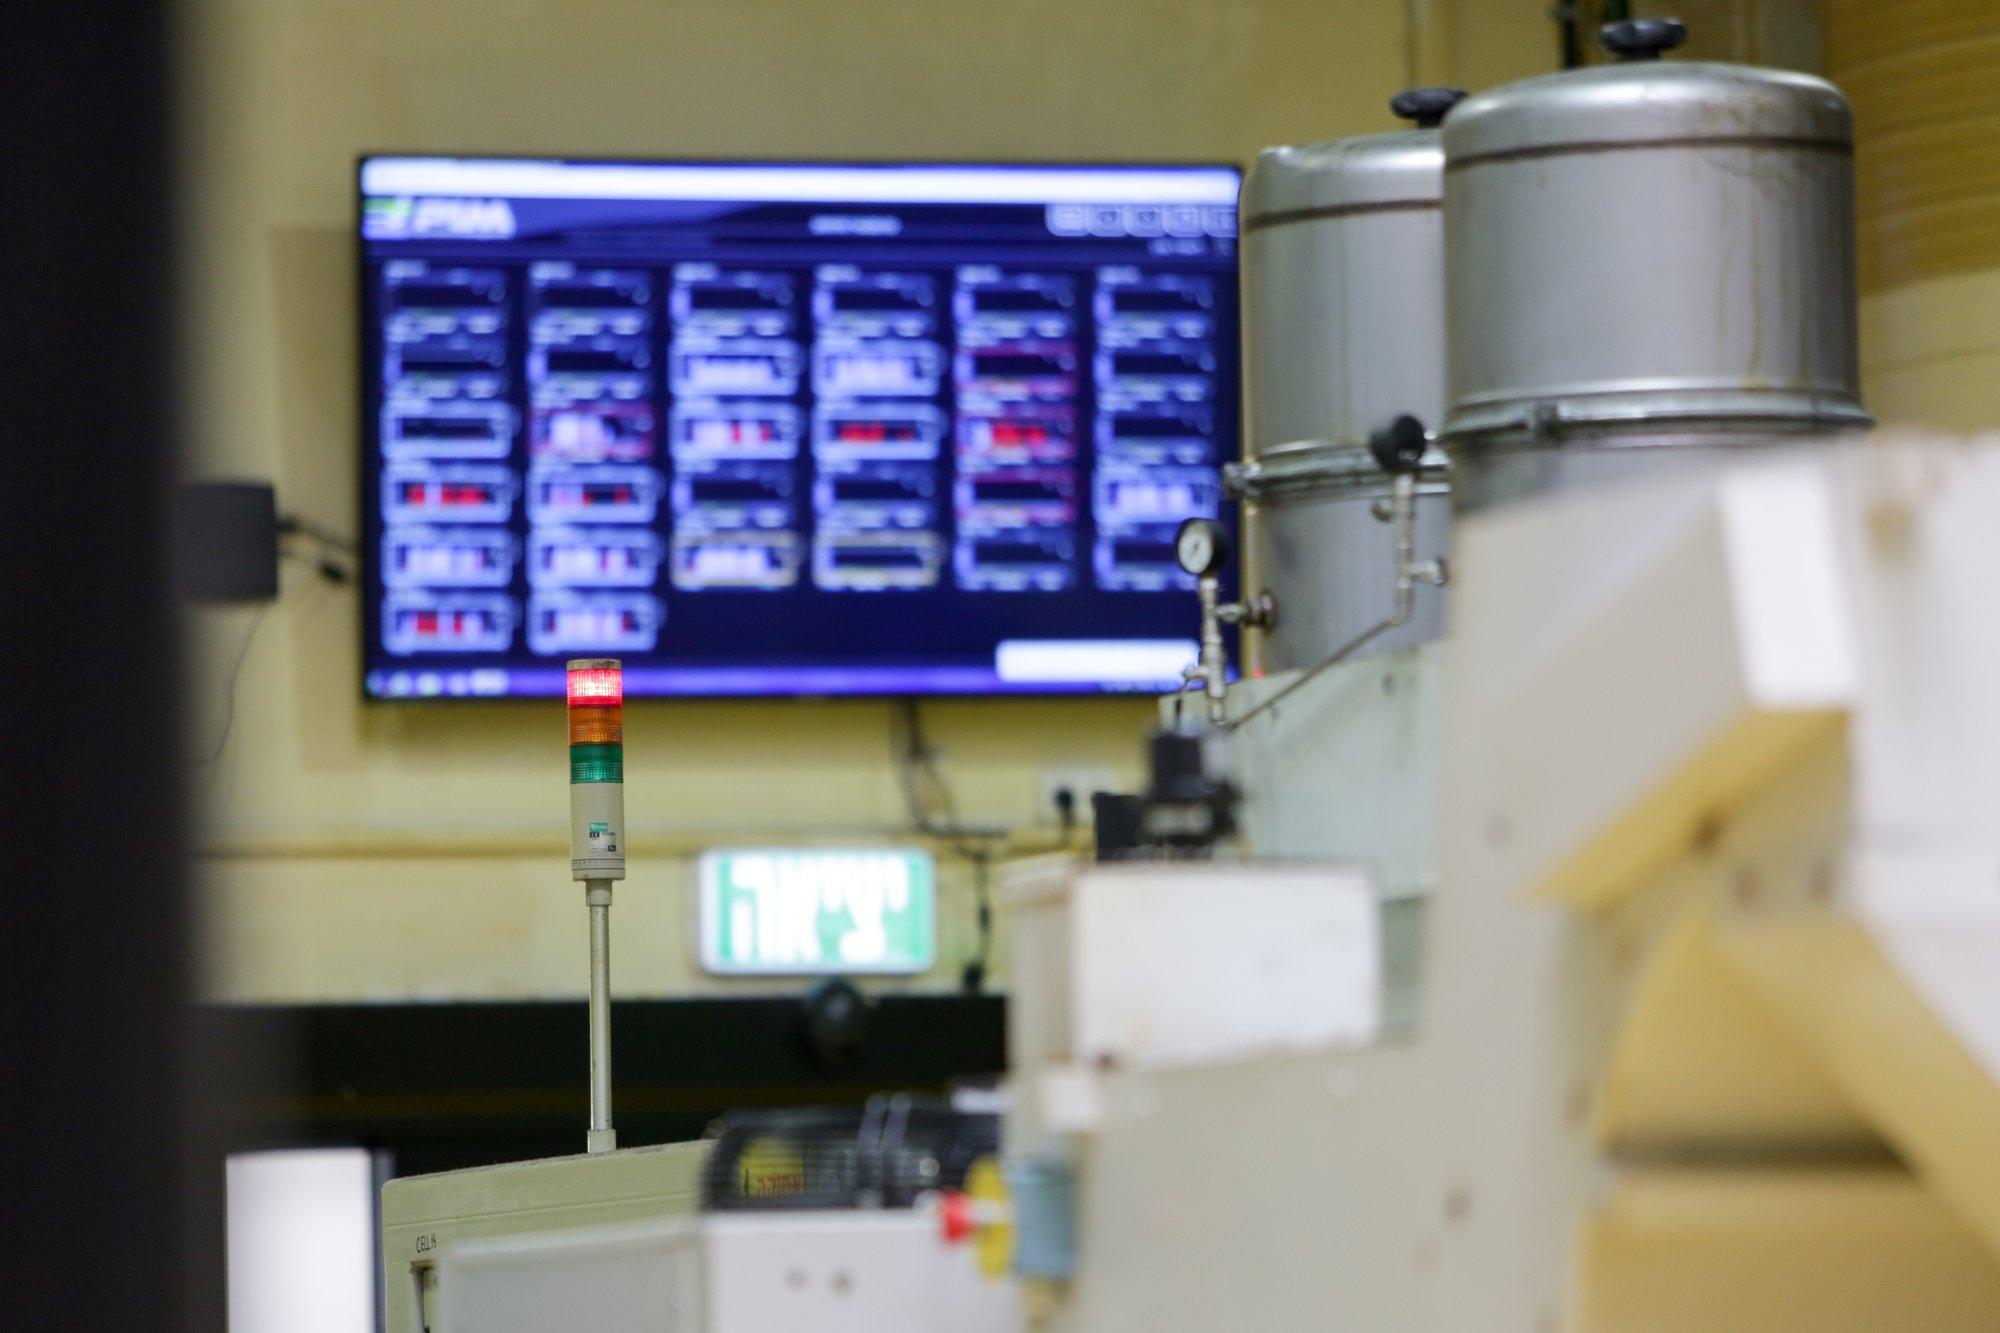
Availability, performance, quality — per machine, per shift
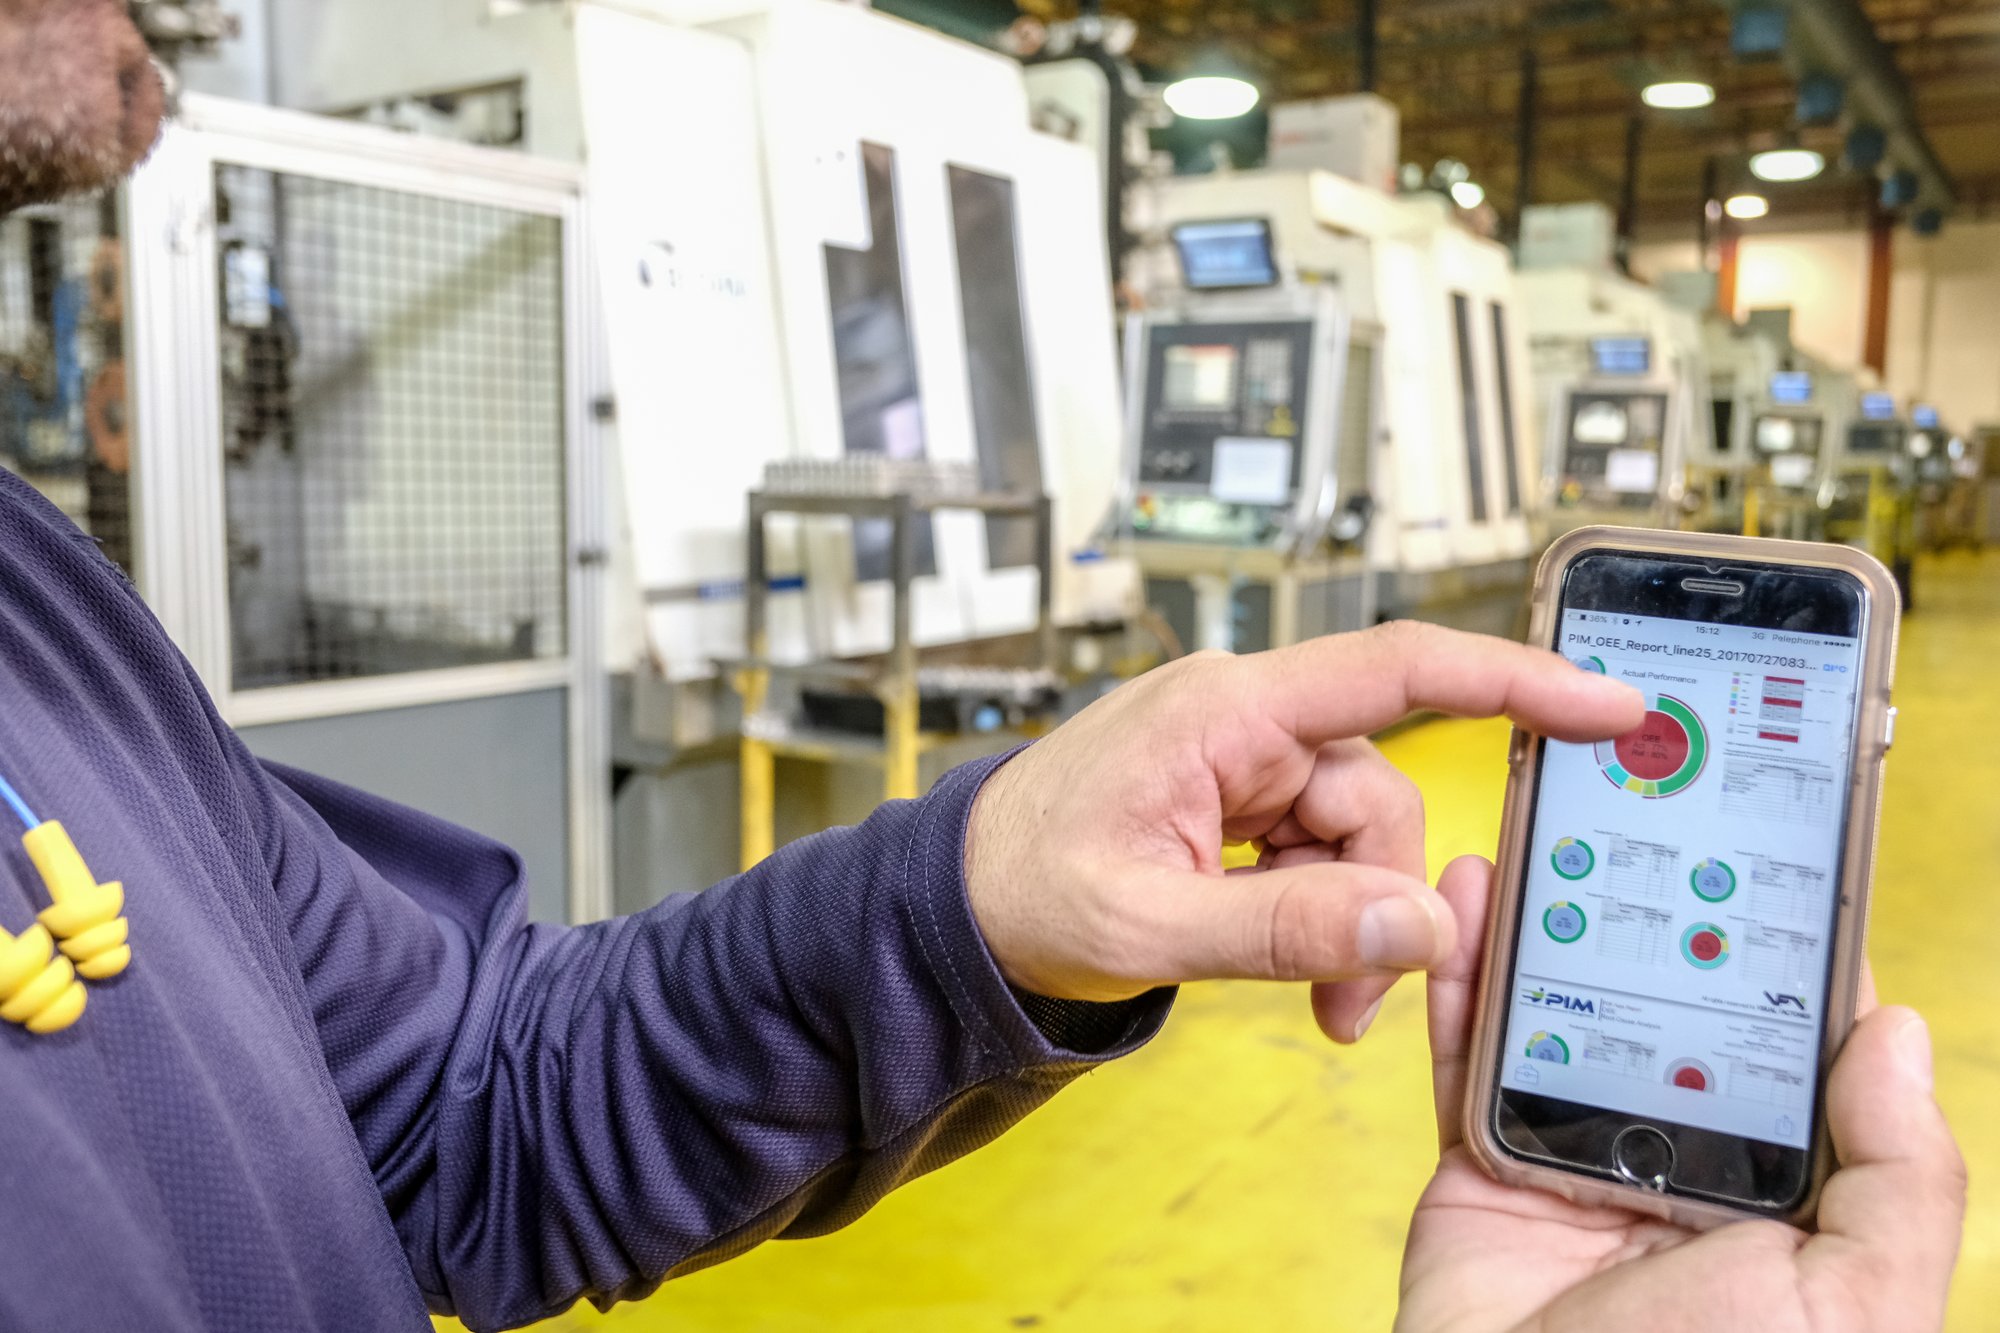
Uptime, downtime and throughput straight from the machine's signals. Live targets on the floor monitor; the same truth in the office and on the phone.
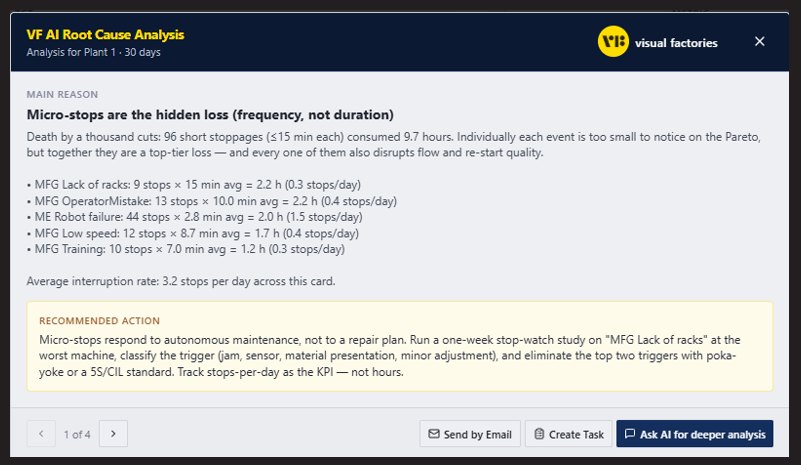
The top offenders, with the reason and the fix
Operators add reasons in one tap; the AI agent ranks losses by what they cost — including the micro-stops the Pareto misses — and recommends the action.
Tasks assigned, tracked and closed
One click turns a finding into a task with an owner and a due date. MTBF and MTTR by machine, alerts on the phone, daily PDF report to management.
The losses are already on your floor. We make them visible — and assign them.
Every plant loses output to the same six things. Visual Factories measures each one on each machine, so the improvement plan starts from facts, not opinions.
- ABreakdowns — unplanned stops, with MTBF and MTTR per machine
- ASetups & changeovers — measured, compared, shortened
- PMicro-stops — by frequency, not duration: the hidden loss
- PReduced speed — actual vs standard cycle time, part by part
- QScrap & rework — where and when defects are made
- QStart-up losses — after every setup, shift and break
One closed loop. Improvement is the outcome of running it.
The system does the work. People follow the loop — and the engagement it asks of them grows only as the results do.
Connect
Any machine, in hours. No IT project.
Zero engagementEmpower
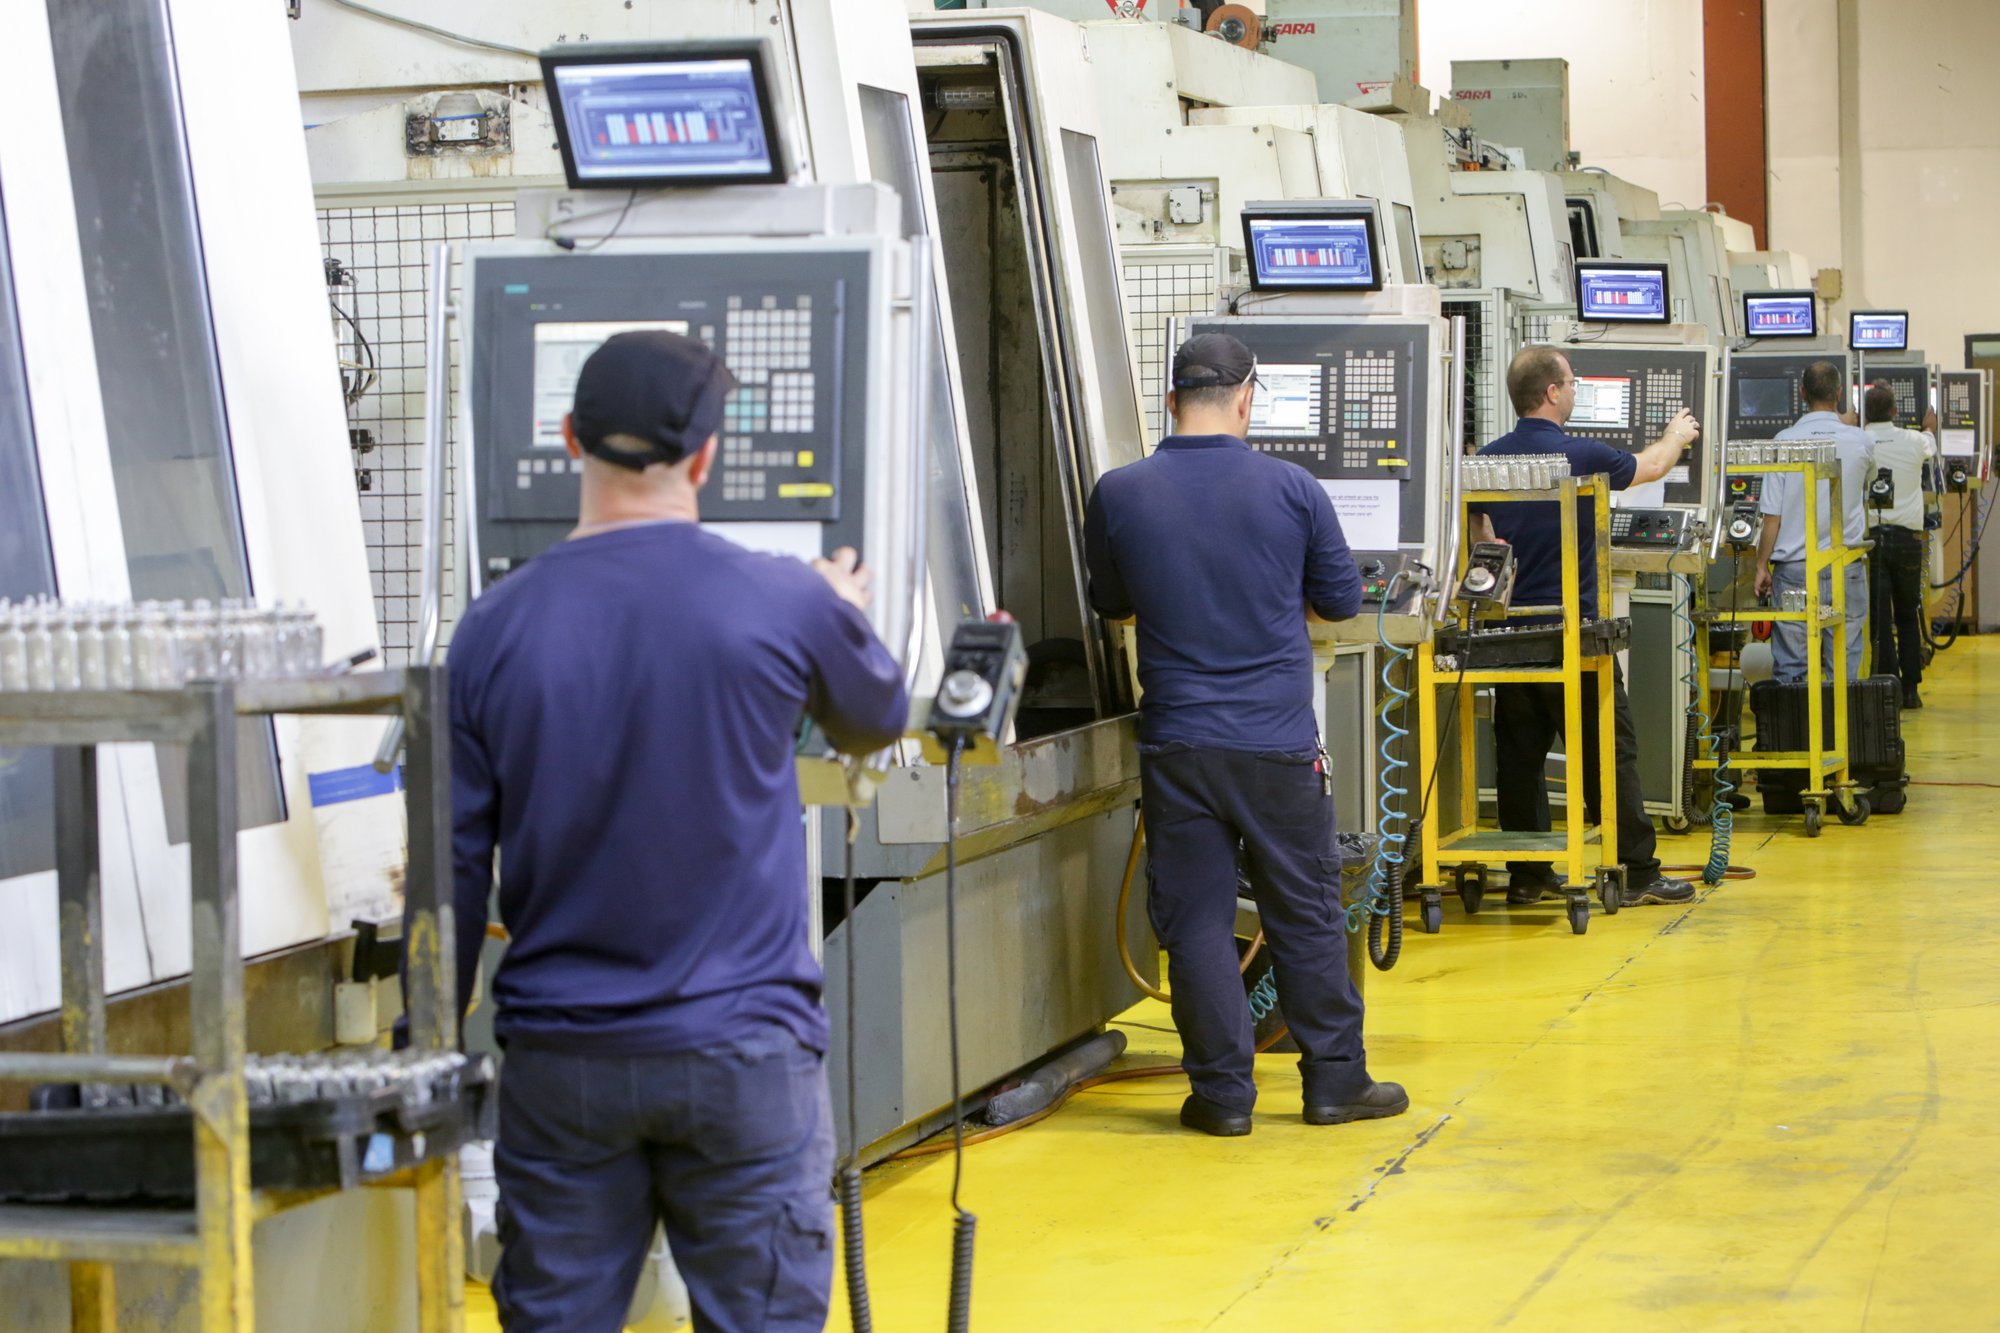
Floor monitors show live targets. Teams self-manage.
Passive engagementAnalyze
Full OEE root-cause on top offenders. Data, not gut feel.
Minimal engagementAct
Plans built, assigned, done. An executive keeps it moving.
Executive engagementAI agent
Finds the cause, creates the task, makes sure people act.
AutomationImprove
Continuous and measurable. The outcome of running the loop.
ResultMachines connected, live OEE on the monitors. Nobody has to change how they work yet.
Operators see the target and the gap in real time. The easy losses close on their own.
Reasons on every stop. The AI ranks the offenders and hands the plan to the right people.
Tasks with owners and dates. One executive makes sure they happen. The 20% arrives.
Measurement becoming improvement.
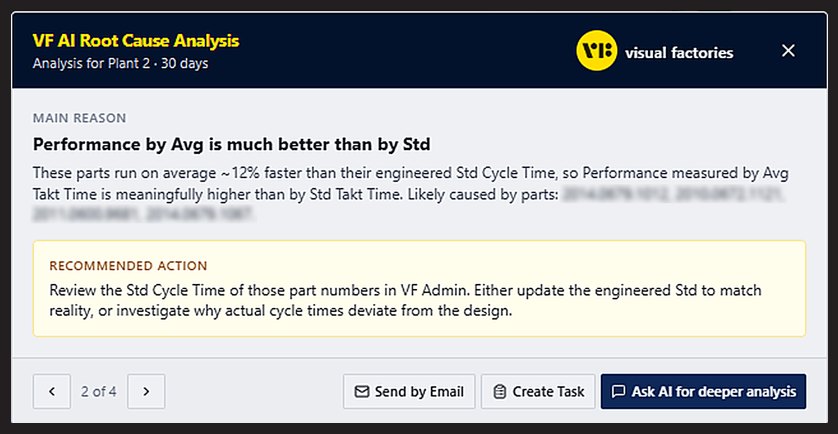
Live from the VF platform: the AI agent finds the reason behind a loss, recommends the action and creates the task — assigned to the right person and tracked through to done. No meetings, no spreadsheets, no lost follow-ups.
See it on your data →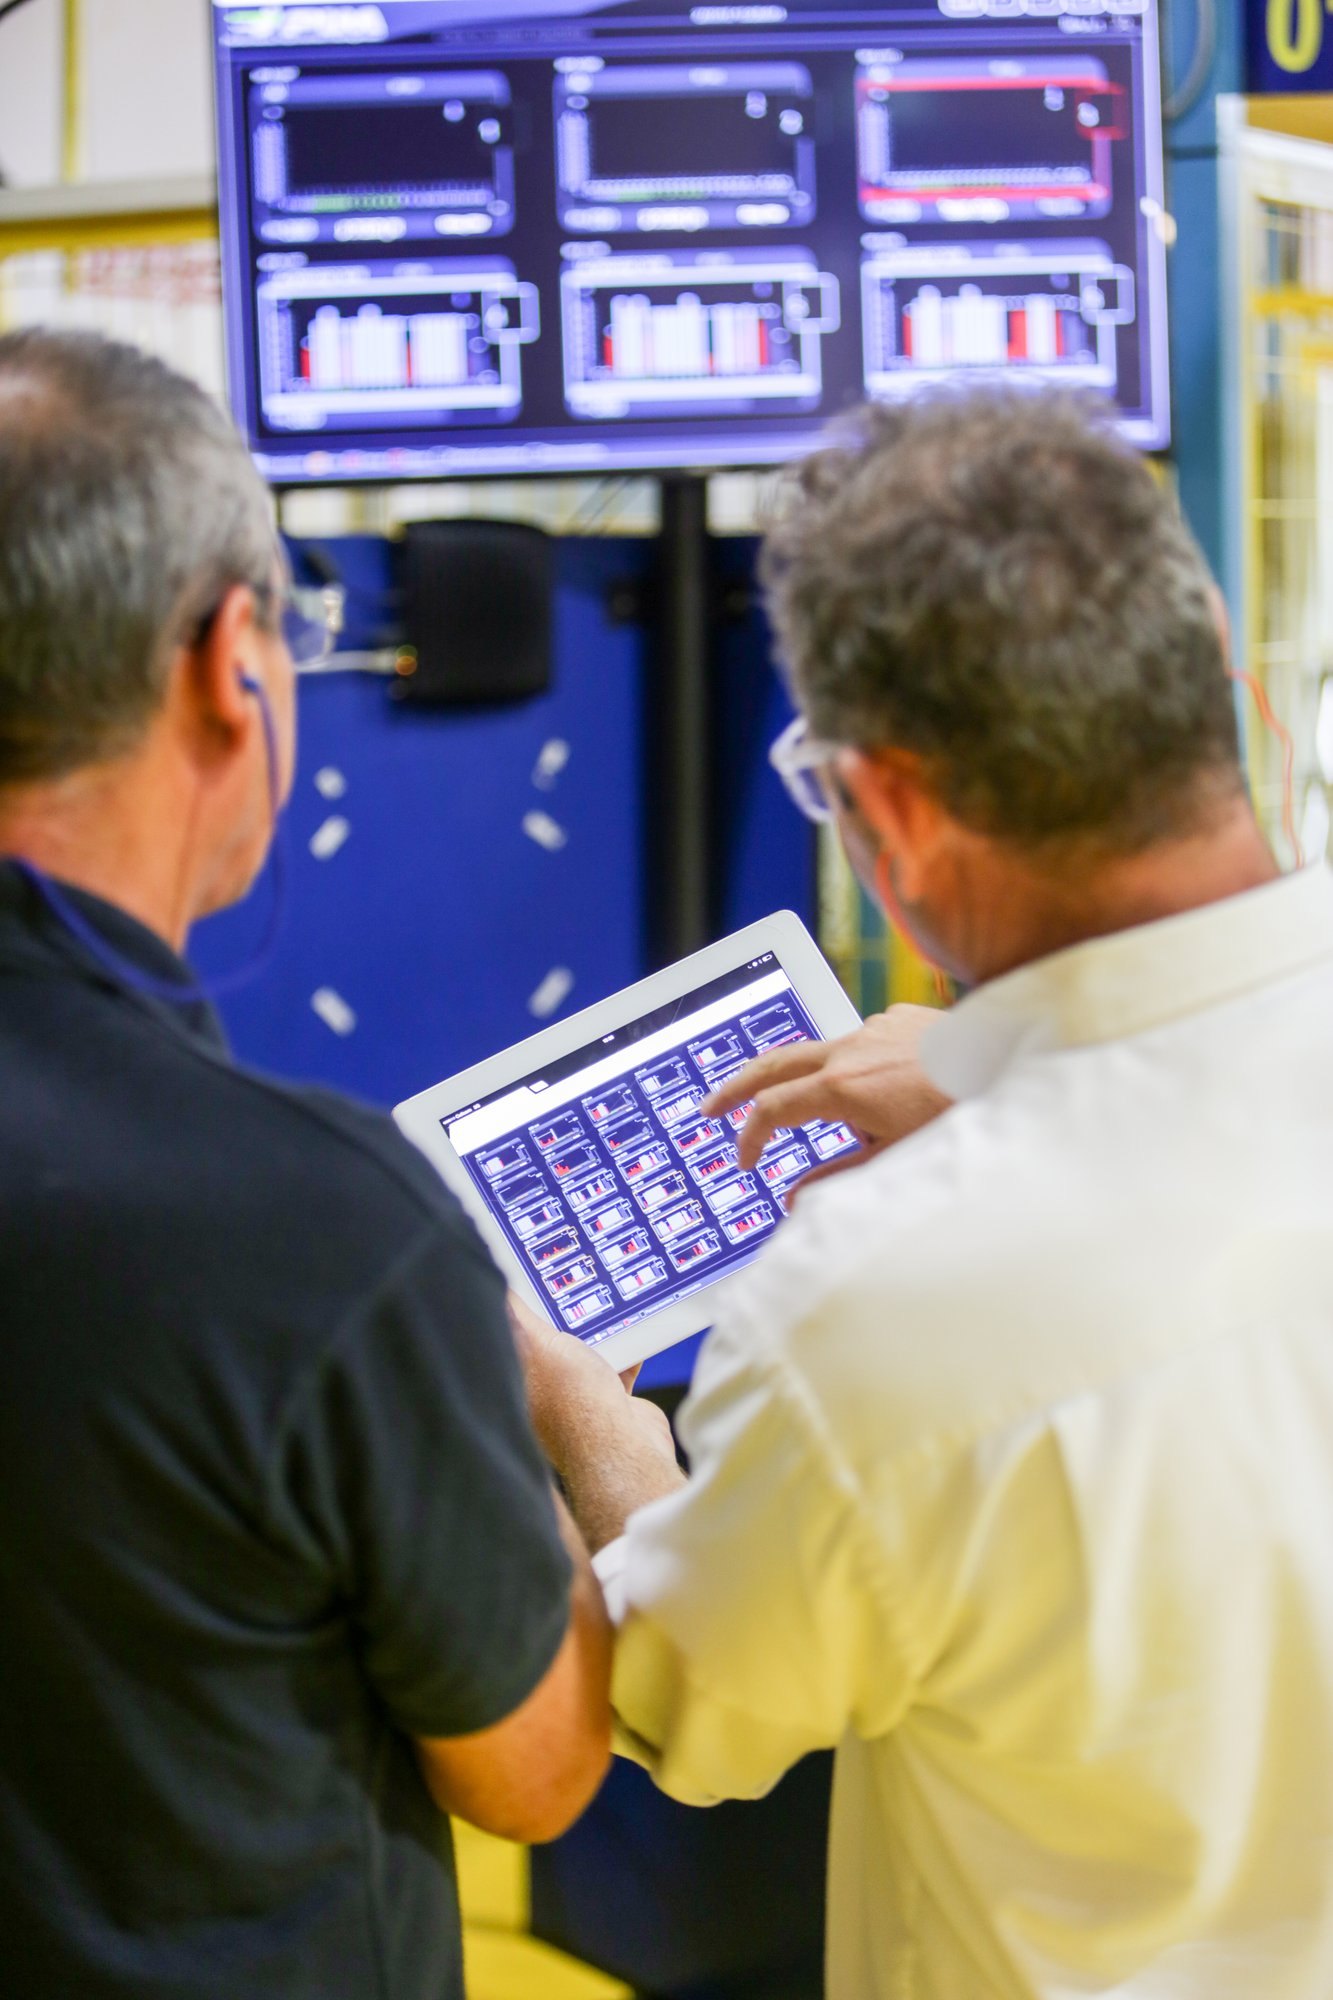
Three cells. Three processes. Same loop.
13-machine cell, Plant 1 — Tier-1 automotive supplier
4-machine injection-molding cell — same supplier
2-machine end-of-line cell — same supplier
Every machine live. Baseline OEE measured, not estimated.
Micro-stops and start-up losses cut by the teams on the floor.
Top offenders fixed through assigned, tracked tasks.
Sustained, on the same machines, with the same people.

Increasing revenue, cutting costs, and reducing overtime
- +27%OEE
- +23%production per day
- −63%overtime hours
- −68%defect parts per million
The system measures, analyzes and assigns. The only thing it cannot do is decide that improvement is a priority. Give the loop one owner with authority, and the results follow.